Part 14: Labor Markets and Income
14.1 The Theory of Labor Markets
Learning Objectives
By the end of this section, you will be able to:
- The Demand for Labor in Perfectly Competitive Output Markets
- The Demand for Labor in Imperfectly Competitive Output Markets
- What Determines the Going Market Wage Rate?
What is the labor market?
The labor market is the term that economists use for all the different markets for labor. There is no single labor market. Rather, there is a different market for every different type of labor. Labor differs by type of work (e.g. retail sales vs. scientist), skill level (entry level or more experienced), and location (the market for administrative assistants is probably more local or regional than the market for university presidents). While each labor market is different, they all tend to operate in similar ways. For example, when wages go up in one labor market, they tend to go up in others too. When economists talk about the labor market, they are describing these similarities.
Introduction
The labor market, like all markets, has a demand and a supply. Why do firms demand labor? Why is an employer willing to pay you for your labor? It’s not because the employer likes you or is socially conscious. Rather, it’s because your labor is worth something to the employer–your work brings in revenues to the firm. How much is an employer willing to pay? That depends on the skills and experience you bring to the firm.
If a firm wants to maximize profits, it will never pay more (in terms of wages and benefits) for a worker than the value of his or her marginal productivity to the firm. We call this the first rule of labor markets.
Suppose a worker can produce two widgets per hour and the firm can sell each widget for $4 each. Then the worker is generating $8 per hour in revenues to the firm, and a profit-maximizing employer will pay the worker up to, but no more than, $8 per hour, because that is what the worker is worth to the firm.
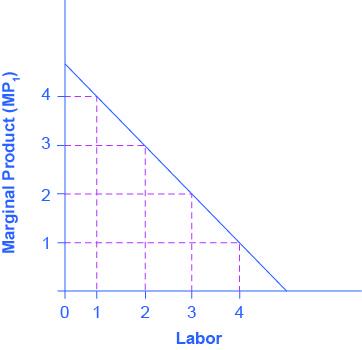
Recall the definition of marginal product. Marginal product is the additional output a firm can produce by adding one more worker to the production process. Since employers often hire labor by the hour, we’ll define marginal product as the additional output the firm produces by adding one more worker hour to the production process. In this chapter, we assume that workers are homogeneous—they have the same background, experience and skills and they put in the same amount of effort. Thus, marginal product depends on the capital and technology with which workers have to work.
A typist can type more pages per hour with an electric typewriter than a manual typewriter, and he or she can type even more pages per hour with a personal computer and word processing software. A ditch digger can dig more cubic feet of dirt in an hour with a backhoe than with at shovel.
Thus, we can define the demand for labor as the marginal product of labor times the value of that output to the firm.
| # Workers (L) | 1 | 2 | 3 | 4 |
| MPL | 4 | 3 | 2 | 1 |
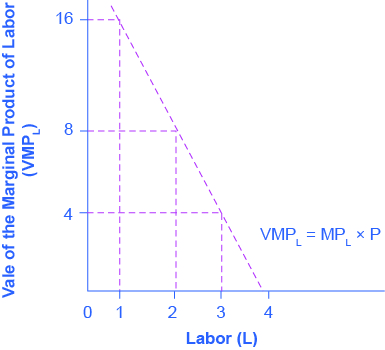
On what does the value of each worker’s marginal product depend? If we assume that the employer sells its output in a perfectly competitive market, the value of each worker’s output will be the market price of the product. Thus,
Demand for Labor = MPL x P = Value of the Marginal Product of Labor
We show this in (Figure), which is an expanded version of (Figure)
| # Workers (L) | 1 | 2 | 3 | 4 |
| MPL | 4 | 3 | 2 | 1 |
| Price of Output | $4 | $4 | $4 | $4 |
| VMPL | $16 | $12 | $8 | $4 |
Note that the value of each additional worker is less than the ones who came before.
Demand for Labor in Perfectly Competitive Output Markets
The question for any firm is how much labor to hire.
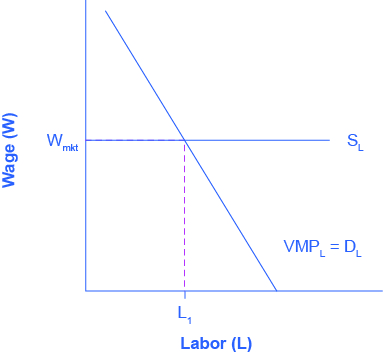
We can define a Perfectly Competitive Labor Market as one where firms can hire all the labor they wish at the going market wage. Think about secretaries in a large city. Employers who need secretaries can probably hire as many as they need if they pay the going wage rate.
Graphically, this means that firms face a horizontal supply curve for labor, as Figure 14.3 shows.
Given the market wage, profit maximizing firms hire workers up to the point where: Wmkt = VMPL
Derived Demand
Economists describe the demand for inputs like labor as a derived demand. Since the demand for labor is MPL*P, it is dependent on the demand for the product the firm is producing. We show this by the P term in the demand for labor. An increase in demand for the firm’s product drives up the product’s price, which increases the firm’s demand for labor. Thus, we derive the demand for labor from the demand for the firm’s output.
Demand for Labor in Imperfectly Competitive Output Markets
If the employer does not sell its output in a perfectly competitive industry, they face a downward sloping demand curve for output, which means that in order to sell additional output the firm must lower its price. This is true if the firm is a monopoly, but it’s also true if the firm is an oligopoly or monopolistically competitive. In this situation, the value of a worker’s marginal product is the marginal revenue, not the price. Thus, the demand for labor is the marginal product times the marginal revenue.
The Demand for Labor = MPL x MR = Marginal Revenue Product
| # Workers (L) | 1 | 2 | 3 | 4 |
| MPL | 4 | 3 | 2 | 1 |
| Marginal Revenue | $4 | $3 | $2 | $1 |
| MRPL | $16 | $9 | $4 | $1 |
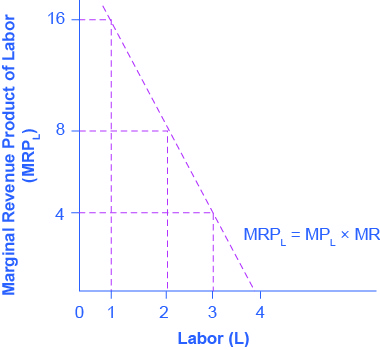
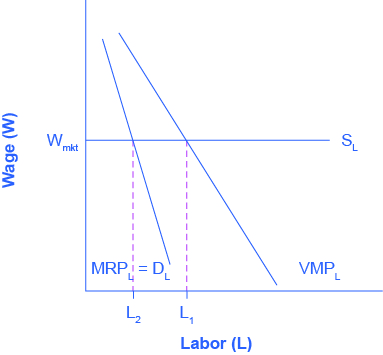
Everything else remains the same as we described above in the discussion of the labor demand in perfectly competitive labor markets. Given the market wage, profit-maximizing firms will hire workers up to the point where the market wage equals the marginal revenue product, as (Figure) shows.
Do Profit Maximizing Employers Exploit Labor?
If you look back at (Figure), you will see that only the firm pays the last worker it hires what they’re worth to the firm. Every other worker brings in more revenue than the firm pays him or her. This has sometimes led to the claim that employers exploit workers because they do not pay workers what they are worth. Let’s think about this claim. The first worker is worth $x to the firm, and the second worker is worth $y, but why are they worth that much? It is because of the capital and technology with which they work. The difference between workers’ worth and their compensation goes to pay for the capital, technology, without which the workers wouldn’t have a job. The difference also goes to the employer’s profit, without which the firm would close and workers wouldn’t have a job. The firm may be earning excessive profits, but that is a different topic of discussion.
What Determines the Going Market Wage Rate?
In the chapter on Labor and Financial Markets, we learned that the labor market has demand and supply curves like other markets. The demand for labor curve is a downward sloping function of the wage rate. The market demand for labor is the horizontal sum of all firms’ demands for labor. The supply for labor curve is an upward sloping function of the wage rate. This is because if wages for a particular type of labor increase in a particular labor market, people with appropriate skills may change jobs, and vacancies will attract people from outside the geographic area. The market supply for labor is the horizontal summation of all individuals’ supplies of labor.
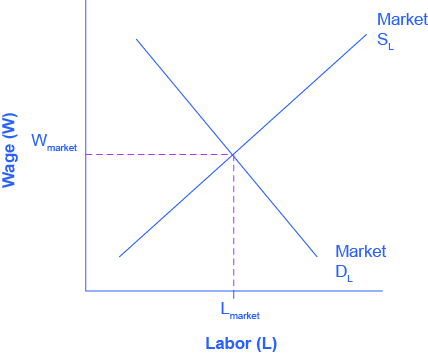
Like all equilibrium prices, the market wage rate is determined through the interaction of supply and demand in the labor market. Thus, we can see in (Figure) for competitive markets the wage rate and number of workers hired.
The FRED database has a great deal of data on labor markets, starting at the wage rate and number of workers hired.
The United States Census Bureau for the Bureau of Labor Statistics publishes The Current Population Survey, which is a monthly survey of households (link is on that page), which provides data on labor supply, including numerous measures of the labor force size (disaggregated by age, gender and educational attainment), labor force participation rates for different demographic groups, and employment. It also includes more than 3,500 measures of earnings by different demographic groups.
The Current Employment Statistics, which is a survey of businesses, offers alternative estimates of employment across all sectors of the economy.
The link labeled “Productivity and Costs” has a wide range of data on productivity, labor costs and profits across the business sector.
Key Concepts and Summary
A firm demands labor because of the value of the labor’s marginal productivity. For a firm operating in a perfectly competitive output market, this will be the value of the marginal product, which we define as the marginal product of labor multiplied by the firm’s output price. For a firm which is not perfectly competitive, the appropriate concept is the marginal revenue product, which we define as the marginal product of labor multiplied by the firm’s marginal revenue. Profit maximizing firms employ labor up to the point where the market wage is equal to the firm’s demand for labor. In a competitive labor market, we determine market wage through the interaction between the market supply and market demand for labor.
Self-Check Questions
(Figure) shows levels of employment (Labor), the marginal product at each of those levels, and the price at which the firm can sell output in the perfectly competitive market where it operates.
- What is the value of the marginal product at each level of labor?
- If the firm operates in a perfectly competitive labor market where the going market wage is $12, what is the firm’s profit maximizing level of employment?
- For a firm operating in a perfectly competitive output market, the value of the marginal product is the marginal product of labor multiplied by the firm’s output price.
- In a perfectly competitive labor market where the going market wage is $12, a profit-maximizing firm will hire workers up to the point where the market wage equals the marginal revenue product. In this case, the market wage equals the marginal revenue product when the labor is 5 because at that level, the marginal revenue product is $12.
(Figure) shows levels of employment (Labor), the marginal product at each of those levels, and a monopoly’s marginal revenue.
- What is the monopoly’s marginal revenue product at each level of employment?
- If the monopoly operates in a perfectly competitive labor market where the going market wage is $20, what is the firm’s profit maximizing level of employment?
- For firms with some market power in their output market, like a monopoly, the value of additional output sold is the firm’s marginal revenue, not the price. This is because they face a downward sloping demand curve for output, which means that in order to sell additional output, the firm must lower its price. The marginal revenue product equals the marginal product of labor multiplied by the marginal revenue.
- A profit-maximizing firm will hire workers up to the point where the market wage equals the marginal revenue product. If the going market wage is $20, in this scenario, the profit-maximizing level of employment is 4 because at that point, the marginal revenue product is $20.
(Figure) shows the quantity demanded and supplied in the labor market for driving city buses in the town of Unionville, where all the bus drivers belong to a union.
- What would the equilibrium wage and quantity be in this market if no union existed?
- Assume that the union has enough negotiating power to raise the wage to $4 per hour higher than it would otherwise be. Is there now excess demand or excess supply of labor?
- With no union, the equilibrium wage rate would be $18 per hour and there would be 8,000 bus drivers.
- If the union has enough negotiating power to raise the wage to $4 per hour higher than under the original equilibrium, the new wage would be $22 per hour. At this wage, 4,000 workers would be demanded while 10,000 would be supplied, leading to an excess supply of 6,000 workers.
Do unions typically oppose new technology out of a fear that it will reduce the number of union jobs? Why or why not?
Unions have sometimes opposed new technology out of a fear of losing jobs, but in other cases unions have helped to facilitate the introduction of new technology because unionized workers felt that the union was looking after their interests or that their higher skills meant that their jobs were essentially protected. And the new technologies meant increased productivity.
Compared with the share of workers in most other high-income countries, is the share of U.S. workers whose wages are determined by union bargaining higher or lower? Why or why not?
In a few other countries (such as France and Spain), the percentage of workers belonging to a union is similar to that in the United States. Union membership rates, however, are generally lower in the United States. When the share of workers whose wages are determined by union negotiations is considered, the United States ranks by far the lowest (because in countries like France and Spain, union negotiations often determine pay even for nonunion employees).
Are firms with a high percentage of union employees more likely to go bankrupt because of the higher wages that they pay? Why or why not?
No. While some unions may cause firms to go bankrupt, other unions help firms to become more competitive. No overall pattern exists.
Do countries with a higher percentage of unionized workers usually have less growth in productivity because of strikes and other disruptions caused by the unions? Why or why not?
From a social point of view, the benefits of unions and the costs seem to counterbalance. There is no evidence that in countries with a higher percentage of unionized workers, the economies grow more or less slowly.
Review Questions
What determines the demand for labor for a firm operating in a perfectly competitive output market?
What determines the demand for labor for a firm with market power in the output market?
What is a perfectly competitive labor market?
What is a labor union?
Why do employers have a natural advantage in bargaining with employees?
What are some of the most important laws that protect employee rights?
How does the presence of a labor union change negotiations between employers and workers?
What is the long-term trend in American union membership?
Would you expect the presence of labor unions to lead to higher or lower pay for worker-members? Would you expect a higher or lower quantity of workers hired by those employers? Explain briefly.
What are the main causes for the recent trends in union membership rates in the United States? Why are union rates lower in the United States than in many other developed countries?
References
AFL-CIO. “Training and Apprenticeships.” http://www.aflcio.org/Learn-About-Unions/Training-and-Apprenticeships.
Central Intelligence Agency. “The World Factbook.” https://www.cia.gov/library/publications/the-world-factbook/index.html.
Clark, John Bates. Essentials of Economic Theory: As Applied to Modern Problems of Industry and Public Policy. New York: A. M. Kelley, 1907, 501.
United Auto Workers (UAW). “About: Who We Are.” http://www.uaw.org/page/who-we-are.
United States Department of Labor: Bureau of Labor Statistics. “Economic News Release: Union Members Summary.” Last modified January 23, 2013. http://www.bls.gov/news.release/union2.nr0.htm.
United States Department of Labor, Bureau of Labor Statistics. 2015. “Economic News; Union Members Summary.” Accessed April 13, 2015. http://www.bls.gov/news.release/union2.nr0.htm.
Glossary
- first rule of labor markets
- an employer will never pay a worker more than the value of the worker’s marginal productivity to the firm
- perfectly competitive labor market
- a labor market where neither suppliers of labor nor demanders of labor have any market power; thus, an employer can hire all the workers they would like at the going market wage
