Dating Methods in Archaeology
Note – We are currently beta testing this textbook. If you are a student who has been assigned this reading, we would appreciate any feedback you may have. After finishing the chapter, please go to https://forms.gle/3QDm5QYi4ft4wbnXA to complete a short survey.
Kaitlin Hakanson, M.A., R.P.A.
Linkville Cultural Resource Management, Klamath Falls, OR, USA
Learning Objectives
-
Describe the range of dating methods commonly used in archaeological research
-
Articulate the advantages and disadvantages of specific dating methods
-
Explain how theories from the geosciences and biological sciences have been applied to the analysis of archaeological materials
-
Identify the terminology used by professional archaeologists and geoscientists to describe the age of a sample
In modern times, archaeology uses methods from both the natural sciences and social sciences to conduct scientific investigations with a strong focus on determining the age of objects. This has not always been the case, however. For centuries, archaeologists were seen as keepers, and looters, of mysterious objects that represented exotic lands and peoples. Artifacts were treated as art objects, and it was rare for a historian to ask living peoples about how their ancestors saw the world. This led to Euro-centric interpretations of human history that still carry on to this day, especially in the form of “documentaries” like the infamous Chariots of the Gods? book by Erich von Däniken, which was followed two years later in 1970 by a wildly popular feature-length film. An in-depth discussion of how interpretations of the past have recently moved toward more culturally diverse perspectives and methods can be found in the Social Impact chapter of this text. This chapter focuses on the most common methods used to conduct scientifically-informed research of past societies and peoples. Glamorized and not-so-scientific interpretations of the archaeological record by untrained people is discussed in the Pseudoarchaeology chapter of this text.
Over the last 70 years, continual advancements in analytical technologies and computing power have made it possible for scientists to accurately estimate the age of – objects that exist as a result of human activity, as well as – rock and mineral fragments. Modern technology allows us to identify the chemical composition of many organic and inorganic materials. Some examples include the geologic materials our ancestors used to create pigments and clay (Clelland et al., 2015); biological material like calculus from teeth to interpret ancient diet (Cristiani, et al., 2018) and intact genetic material from preserved bone and hair. Being able to gather (numerical data) from organic and inorganic archaeological materials has revolutionized our ability to understand the past.
This is a far cry from the methods and interpretations made by British Victorian who collected artifacts from sites all over the world. Sadly, many of the most famous artifacts were removed from sites without any description of where they came from, unless that made them more expensive. The majority of the looted objects were bought and sold by aristocrats as part of the art scene or put on display in private collections. With the world’s appreciation of archaeological materials focused on beauty and artistic skill, the question of age wasn’t explored in any significant way until the late 1800s.
V. Gordon Childe, an Australian archaeologist, is credited with bringing the idea of determining dates for archaeological materials to British archaeology in the late 1920s. This new approach, called culture-historical archaeology, emphasized classification of objects and the creation of typologies, allowing researchers to identify distinct ancient cultures (Trigger, 2007). This more meticulous approach also enabled researchers to assign ancient societies to different time periods, forming the basis of , or the ability to differentiate older artifacts from younger ones. No longer were artifacts just called “ancient”; now it was possible to accurately assign artifacts to different periods that were corroborated by written records. also became recognized as a valuable perspective on ancient history. While groups of artifacts could now be given a general time frame for when they were made and used, precise dates would not be possible until the Radiocarbon Revolution in the 1940s. In the United States, the method of came directly out of research on radioactive minerals, like uranium-235, which was being studied for its capacity to generate massive amounts of energy. After the deployment of atomic weapons in the 1940s, scientists gained a new understanding of the nature of objects at the atomic level.
As a scientific endeavor, modern archaeological analysis utilizes current technology and analysis techniques, keeping research fresh, active, and dynamic. It integrates the knowledge, expertise, and perspectives of researchers globally by agreeing to use the same notation, allowing information to be shared and disseminated more easily and accurately. The chart below summarizes the most commonly used notation for reporting dates.
|
Notation |
Meaning |
Dates for Çatalhöyük (Turkey) |
Context |
|
years ago |
calendar years ago |
9,500 to 8,400 years ago |
Informal, public settings |
|
BC / AD |
Before Christ / anno Domini |
7500 BC to 6400 BC |
Mass media and historical records from Christian authors |
|
|
Before Common Era / Common Era |
7500 BCE to 6400 BCE |
Scientific and academic writing. Faith-neutral version of BC / AD |
|
BP |
years Before Present (present is 1950 CE) |
9,450 – 8,350 BP |
Scientific and academic writing, simplifies BCE / CE dates |
|
|
calibrated years Before Present |
9,219 – 8,889 cal BP (+/- 200) |
Radiometric dates corrected using calibration curve, adjusted to 1950 CE scale |
|
RCYBP |
Radiocarbon Years Before Present |
9,219 – 8,889 RCYBP (+/- 200) |
Alternative notation for cal BP |
|
cal BCE |
calibrated years Before Common Era |
7,269 – 6,939 cal BCE (+/- 200) |
Radiometric dates corrected using calibration curve, adjusted to 0 CE scale |
Chart 1: Comparison of the most common abbreviations seen in archaeological dating (Hakanson, 2022).
Clarifying sequences of events is the most valuable benefit of dating archaeological materials. For example, through relative dating gleaned from thousands of Egyptian, Roman, and Greek records, we know that the Egyptian pharaoh Tutankhamun ruled during the 18th dynasty of the New Kingdom period. And, through radiometric dating of plant remains found in his tomb, we know that his reign was from 1353 to 1331 BCE, earlier than Egyptologists had previously thought based on written records alone (Balter, 2010).
Having a precise date range allows us to have a global context for archaeological finds. This helps us to recognize that many societies have flourished throughout history and across the globe, not just in places with written records and intensive agriculture. It also helps in the identification of fakes and forgeries, which for centuries have misled well-meaning people into poorly-informed interpretations of human social behavior. Scientifically-informed dating methods give archaeology credibility as a science, which builds trust between researchers and communities who seek help in understanding our shared past.
Relative Dating
Fundamentals
With the right information, it’s possible to reconstruct a sequence of events. This is a fundamental concept used in archaeology, and it is an idea that can be traced to the field of geology. Geologic processes are an essential component of any archaeological investigation because they help us reconstruct the order of events that happened at a site. By comparing observations about erosion, volcanic eruption, flooding, and seismic activity to the patterns we see in rock and soil, we can piece together the geologic history of a specific area. Just as rivers can change their course in a few decades, we know that ancient rivers like the Rio Grande can carve through rock if given enough time, creating natural features like the Grand Canyon. There are many awe-inspiring natural features all over the world, and they are all examples of the depth of or , which is also discussed in the Social Impact chapter of this text.
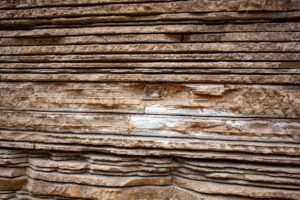
The geologic time scale can be difficult to understand because geologic processes take place over thousands-to-millions of years. We rely on the observations of our predecessors to understand how slowly our planet changes. The is the idea that if you choose one specific patch of soil, and you dig down through the different layers, the layers at the bottom of your hole were deposited first. Then, as you move up out of the hole, each layer you see as you get closer to the surface is younger than the one below. This phenomenon was described by the Danish scientist Nicolaus Steno in 1669. He also observed that, especially on a large scale, sediments are usually deposited in horizontal, flat-lying layers (Montgomery & Dathe, 1994) (Figure 1).
Over time, these layers accumulate or are stripped away by cycles of hot and cold weather, ultraviolet (UV) radiation from the sun, and other natural events. The age of rocks is relevant to archaeologists because “dirt” comes from the breakdown of rocks, minerals, and organic material. “Dirt” can also turn into rocks over long periods of time.
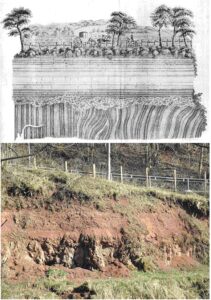
In the 1780s, James Hutton conducted geochemical analysis of two geologic features in his home country of Scotland: Hutton’s Unconformity and Siccar Point. Hutton’s Unconformity has sedimentary beds running vertically in one layer, then horizontally in the layer above (Figure 2). Although researchers were not able to explain vertical formation of rock beds until decades later, it would have taken millions of years for all of the different types of rocks and soils to form (Montgomery, 2003).
If we consider the fact that anatomically modern humans were living at Pinnacle Point, South Africa at least 170,000 years ago (Marean et al., 2007), it’s not surprising that remnants of behavior are left behind in the soil as well, creating an important link between the history of our species and the changes that Earth has experienced since its formation over 4 billion years ago. The field of encourages us to then move our focus to the Cradle of Humankind region, also in South Africa, where we realize that the history of our species goes back millions of years. As people use resources and set up their homes in places, they leave behind evidence of what they are doing. Certain parts of the globe have had people living in the same place for tens, or even hundreds, of thousands of years, which allows layer after layer of artifacts to accumulate over time. In other places where people did not spend significant time, or there were fewer people around, there were fewer opportunities for things to be left behind for archaeologists to find.
Determining cultural periods
Relative dating also refers to assigning an object to a based on its color, size, shape, and other physical characteristics. To do this accurately, archaeologists must cross-reference the objects they find with descriptions of artifacts compiled by previous archaeologists, historians, and looters. Museums have millions of artifacts in their collections that are used as reference when a new object is found. By organizing artifacts into categories based on where they were found, what they are made of, their shape, their thickness, their length, and other attributes, archaeologists and historians have been able to “chunk out” different periods of time based on what people were making and doing. This is called , arrangement in a series or orderly sequence. Stylistic seriation focuses on different designs or styles of objects, and frequency seriation compares the proportional abundance of a design style through time (Figure 3).
There are many different cultural periods defined around the world, created by the local archaeologists who conduct the research. Chinese archaeologists define the Paleolithic, Neolithic, Ancient, Imperial, and Modern periods, while Ecuadorian archaeologists focus on the Formative, Pre-Inca, and Colonial periods (Figure 4). It can be confusing keeping these different divisions straight, and they change over time. Focusing on the age of specific settlements, artifacts, or events can make the picture clearer, revealing the diversity of human societies through time.
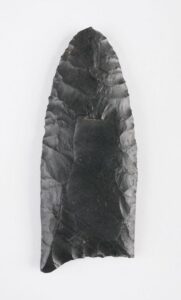
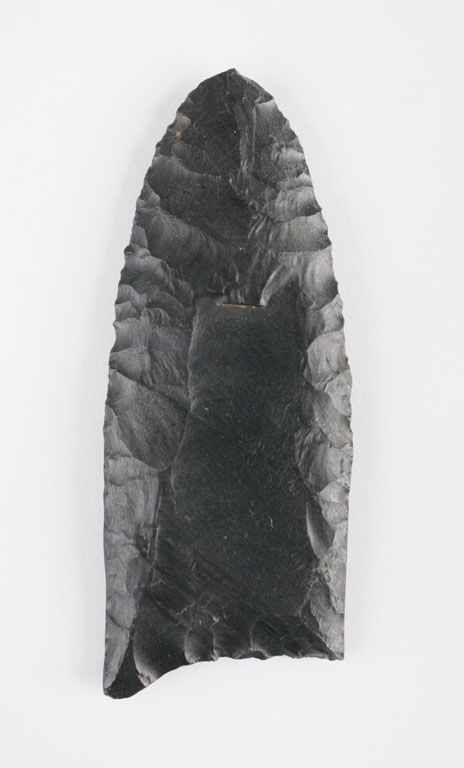
A is a specific type of artifact that marks a specific period of time in the archaeological record. Once a chronology of artifact types and styles is built for a region, it is extremely useful for archaeologists. Clovis points, a prehistoric projectile point style and manufacturing process, is diagnostic of the Paleoindian Period. This point style was used across modern-day United States and Mexico (Figure 5).
No matter where a Clovis point is found, it can be used to date associated artifacts and contexts to the Clovis Period, approximately 13,000 – 11,000 BP (Halligan et al., 2016). The style, size, and materials used by the Clovis culture are consistent enough for researchers to say that the technique is the same, and that Clovis culture, including the knowledge of how to make their distinctive point, quickly spread as an idea throughout the region, much faster than the artifacts themselves could have moved. This tells us that the communities of the Paleoindian Period were well connected and able to communicate quickly and accurately over long distances. The discovery of stone tools that are older than Clovis has clearly demonstrated that humans were in the Americas at least 14,000 years ago, causing many archaeologists to revisit the story of when humans first arrived (Halligan et al., 2016).
In North America, the main cultural periods are the Prehistoric, Colonial, and Historic. Colonists impacted different regions at different times, and so many Colonial-era archaeological investigations use dates that correlate with major events, such as the Jamestown settlement in Virginia, or The Rogue River Wars in Oregon. A similar approach is taken with Historic-era investigations, with periods such as World War II or the Korean War helping to define what documents or are consulted for information. As you might suspect, the more recent the event or cultural period being studied, the more likely it is that data is available to study. Archaeologists don’t just date artifacts that have been excavated during their fieldwork; they are just as likely to date an artifact that has been housed in a museum for decades and has detailed notes about where the object came from, who created it, and what it was used for.
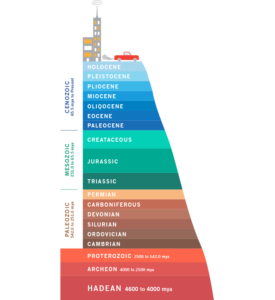
Earlier it was mentioned that anatomically modern humans have been around for at least 170,000 years. However, most archaeological investigations focus on the last 20,000 years of cultural development (at least in the Americas). If we use the geologic time scale to describe the current position of Homo sapiens in the sands of time, we live in the Cenozoic Era, during the Quaternary Period, in the Holocene Epoch. While not officially accepted by the scientific community, archaeologists have pointed out that humans have accelerated climate change and other environmental catastrophes, leading to the discussion of calling the period starting in 1950 the (Figure 6)
Methods
Written markers
Written records can be used to date significant events, people, locations, and also add to our understanding of past religions, worldviews, and behaviors. Writing systems use different sets of symbols to represent sounds or ideas. Many different forms of writing have existed over time.
 |
 |
 |
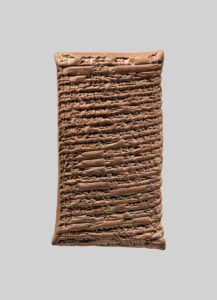 |
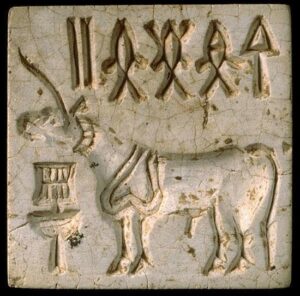
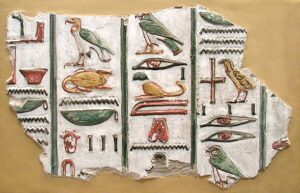
Figure 7 – Images of writing systems that have existed over time, left to right:
Jiahu symbols: 6,000 BCE, Peiligang culture, China (Unnamed author, US public domain via Wikimedia Commons. https://commons.wikimedia.org/wiki/File:Jiahu_writing.svg);
Intaglio Indus script seal: 2,200 BCE, Harappan culture, India and Pakistan. (Harappa Archaeological Research Project, educational use. https://www.harappa.com/sites/default/files/styles/galleryformatter_slide/public/slides/5_2_0.jpg?itok=dSuWH7W5);
Fragment of a wall with hieroglyphs from the tomb of Seti I: 1,294 BCE, Egyptian culture, Egypt. (Unnamed Egyptian scribe, Copyrighted free use via Wikimedia Commons. https://commons.wikimedia.org/wiki/File:Hieroglyphs_from_the_tomb_of_Seti_I.jpg);
Private letter in cuneiform script: 1,632 BCE, Babylonian culture, Syria.
(Unnamed Babylonian, US public domain via Wikimedia Commons. https://www.metmuseum.org/art/collection/search/321706).
Ancient scripts have to be deciphered before archaeologists can use the information contained within the text to make interpretations about past cultures. It took archaeologists several decades to decipher Maya glyphs, using objects like the Dresden Codex (a bark-paper book from the 1200s) to meticulously document and cross-reference each glyph. Once Mesoamerican archaeologists could “read” the thousands of stone tablets and codices, our understanding of Maya society was revolutionized (Figure 8).
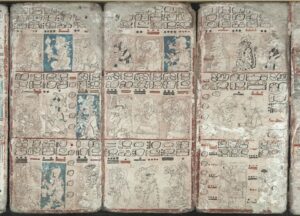
Unnamed scribes, by Linear77 CC BY-SA 3.0 via Wikimedia Commons.
https://commons.wikimedia.org/wiki/File:DresdenCodexCorrectReadingSequence.jpg
Sometimes people documented the exact date a significant event happened, such as in diaries, wills, official records, books, photographs, and newspapers. In North America, Historic archaeologists use written records extensively in their research. In some cases, Historic archaeologists use excavation and artifact analysis to test the accuracy of written records. This is where archaeological techniques cross over into forensic science. Some documents from the colonial period are used by Prehistoric archaeologists to reconstruct pre-colonial societies, but written records before that time are rare. Instead, most cultural knowledge was passed on through generations using oral traditions.
3D scanning and photogrammetry
While traditional drawings and photos capture a great deal of information about an artifact, they cannot capture the full three-dimensional reality of archaeological and architectural features. Photogrammetry uses photographs to create maps that show topography, vegetation, and culturally significant features. 3D scanning uses the same principle but takes thousands of measurements of an object using a laser. These measurements are then compiled by a computer program which “draws” the object as a 3D model. Photogrammetry usually captures more surface detail than 3D scanning, so images can be used to gather data about an artifact, and possibly assign it to a specific cultural period. High resolution 3D scans of artifacts and architectural features can be used to 3D print reproductions or lab models. Being able to transport highly accurate models of specific artifacts to archaeologists around the world has enabled a higher degree of accuracy in assigning artifacts to approximate cultural periods. Archaeologists can also perform 3D scanning to help date museum specimens, since we need to continually reevaluate relative dates.
Dendrochronology
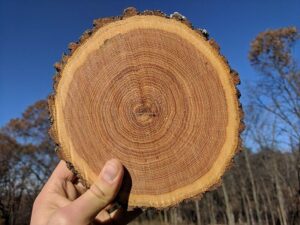
Dendrochronology was one of the first used to date archaeological materials. The technique works by counting individual growth rings on a cross-section of lumber or whole trees that were used by humans for building structures or producing wooden artifacts (Crow Canyon Archaeological Center, n.d.). Trees grow by adding layers of new material to their outside surface. There are visible rings on a cross-section of a cut tree – each ring is the outer layer of the tree that was covered up by the growth it experienced the following year. The color and size of the rings also reflect changing environmental conditions or even injuries and times of stress for the tree (Figure 9).
The twist is that counting the rings on a cut tree only tells you how old that tree was when it was cut down. What if that tree was cut down and used to build an adobe 100 years ago? The real question that needs to be answered is how long ago that tree was growing. Dendrochronology databases have been created using thousands of tree samples in Europe and the Americas. By laying these timelines side by side, and adjusting their alignment until all of the sizes and colors of the growth rings match, archaeologists have identified long, unbroken spans of time, a sort of tree ring clock. English archaeologists applied this technique to the Sweet Track, an ancient timber causeway in the Somerset region in the early 1990s. By comparing the growth rings from the individual wood pieces in the causeway to samples in several databases, they were able to date the feature to precisely 3,807 BCE (New Scientist, 1990). No other instrumental technique is this precise.
Fluorine dating
Chemical dating was developed in the 19th century and represents one of the early attempts to use soil composition and chemistry to date artifacts. A specific type of chemical dating is fluorine dating, and it is commonly used to compare the age of the soil around artifacts located in close proximity. Soils contain different amounts of chemicals, and those chemicals, such as fluorine, can be absorbed by human and animal bones buried in the soil. The longer the remains are in the soil, the more fluorine they will absorb (Cook and Ezra-Cohn, 1959). This technique is particularly useful for determining whether different artifacts come from the same burial context. If they were buried in the same soil for the same length of time, their fluorine signatures should match. The infamous Piltdown Man forgery was identified as a fake by using fluorine dating. The specimen was presented as Darwin’s “Missing Link”, when in fact the cranium came from at least two medieval era humans, and the jaw came from a modern Bornean orangutan. All three parts had different amounts of fluorine present, indicating that they were not all buried at the same time, and couldn’t all be from the same individual. (De Groote et al., 2016).
Palynology

Palynology is the study of pollen grains and other airborne spores. Like dendrochronology, this technique relies on our knowledge of past environmental periods and ecology to make estimates about when humans were doing things. Plants produce and release their pollen at predictable times of year. Also, different species of plants produce pollen grains of different sizes, shapes, and textures. Pollen can be extracted from soil samples from an archaeological site, and then examined under a microscope. Archaeologists trained in this technique can distinguish different genera of grasses, trees, shrubs, and other plants based on pollen grains (Figure 10).
By figuring out which types of plants left their pollen in the stratigraphic levels of a site, those levels can be linked to different paleoenvironments, and thus time periods. For example, there was a dramatic change in the types of plants living during the Pleistocene compared to the Holocene. There was also a shift in how common grasses were compared to trees. Link the amount and types of pollen found on the surface of a stone tool to a specific time period, and you can estimate when humans were at that spot. It can also help determine what season of the year a site was used, presence or absence of agricultural practices or products, and plant-related activity areas within an archaeological context (Crow Canyon Archaeological Center, n.d.).
Radiometric Dating
The age of the Earth had been a hotly debated topic in the western world beginning in about the 1600s. Religious leaders, philosophers, and physicists made both educated estimates and tedious calculations in their attempt to define it. The debate intensified in the 1700s with new theories from the geosciences (mentioned earlier). However, the stage was not set for the technique that would lay most of these questions to rest until 1896, when radioactivity was discovered.
In January of 1896, while investigating the curiosity of some uranium salts that continue to emit light after a light source is removed, Henri Becquerel discovered that something coming from these salts was able to pass through metal photographic plates. He had discovered X-rays, sparking a period of intense research into radioactivity. We now know that uranium is among several dozen natural elements that are – emit energy and particles as individual atoms break down to form other elements. Thorium, polonium, and radium were identified as radioactive by Marie Skłodowska-Curie and her husband Pierre Curie. They were awarded half of the Nobel Prize for Physics in 1903 for their discoveries, along with Becquerel (Nobel Prize Outreach, 2021; Nobel Lectures, 1967).
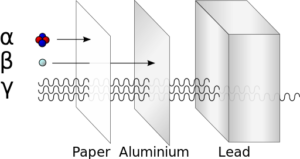
A radioactive is one with an unstable nuclear configuration. Stable atoms have a balance between their positive charges (from the protons within the nucleus) and their negative charges (from the electrons outside of the nucleus). Neutrons don’t have a charge, but they contribute to the atomic weight of an atom. Over time, radioactive isotopes undergo – the nucleus loses energy and emits particles in an attempt to become stable. A nucleus can also eject 2 neutrons and 2 protons stuck together, called an alpha particle. When a nucleus loses an electron through radioactive decay, it becomes a beta particle. Gamma rays are a form of ionizing radiation that is small enough to fit between atoms and break them apart. This is the radioactivity that causes the most damage to biological organisms, and also leaves a mark on rock exposed to the sun (Montgomery & Dathe, 1994) (Figure 11).
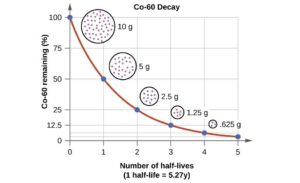
For cobalt-60, which has a half-life of 5.27 years, 50% remains after 5.27 years (one half-life), 25% remains after 10.54 years (two half-lives), 12.5% remains after 15.81 years (three half-lives), and so on.
The way we describe how quickly each type of isotope breaks down is the unit , defined as the length of time required for half of a given number of atoms of that isotope to decay. As an example, the half-life of the radioactive isotope Cobalt-60 is 5.27 years (5 years and 99 days). If a rock sample starts off with 1,000 atoms of Cobalt-60, then after 5.27 years, half of it will decay away naturally, leaving 500 atoms. After another 5.27 years, half of the remaining 500 atoms will decay, and 250 will be left, and so on. Every radioactive isotope has a standard calculated using statistics and principles of nuclear physics (Montgomery & Dathe, 1994). (Figure 12).
Radiocarbon Dating
The development of radiocarbon dating has had a profound impact on archaeology. In addition to permitting more accurate dating within archaeological sites than previous methods, it allows comparison of dates of events across great distances. Histories of archaeology often refer to its impact as the “radiocarbon revolution”. Radiocarbon dating has allowed key transitions in prehistory to be dated, such as the end of the last ice age, and the beginning of the Neolithic and Bronze Age in different regions (Marra, 2019).
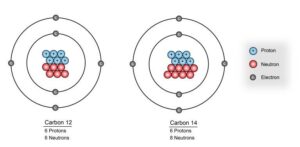
The most commonly called upon carbon isotope for radiometric dating in archaeology is Carbon-14, abbreviated . It has an unstable nucleus containing 8 neutrons and 6 protons. The most common form of stable carbon is 12C, with 6 neutrons and 6 protons. When an atom of 14C decays, a neutron is converted to a proton plus an electron. The proton remains in the nucleus, while the electron (beta particle) is ejected. The result of the decay process is an atom of 14N, which is not radioactive since it has a balance of 7 protons, 7 neutronsv, and 7 electrons (Figure 13)
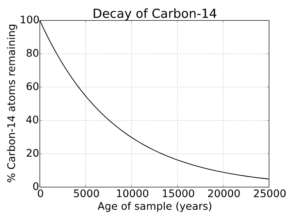
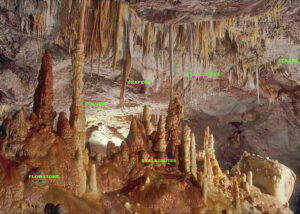
One of the frequent uses of this technique is to date organic remains from archaeological sites. Plants absorb atmospheric carbon during photosynthesis, so the level of 14C in plants and animals when they die approximately equals the level of 14C in the atmosphere at that time. However, the moment they die, the 14C in their body begins undergoing radioactive decay, allowing the date of death or fixation to be estimated (Figure 14). The initial 14C level for the calculation can either be estimated, or directly compared with known year-by-year data from tree-ring data up to 10,000 years ago. Cave speleothems can be dated back to about 45,000 years BP. By comparing the amounts of 14C and contained in a sample with tree ring or cave-deposit carbon-14 levels of a known age, archaeologists produce an approximate age for the sample (Marra, 2019) (Figure 15).
Atoms of 14C and 12C are found in all organic materials and some inorganic materials. The half-life of 14C is 5,730 years, meaning that this technique can give reliable results for objects as old as 40,000 – 65,000 years. After that point, there are so few atoms of 14C left that you need extremely sensitive equipment to detect it, and the age estimate will be less precise. Uncalibrated age estimates are reported using these conventions: “14C year ± date range BP”. For example, the uncalibrated “raw” date “3510 ± 60 BP” indicates that the sample’s uncalibrated age is 3,510 years before present, with an of 60 years. When reading a technical article that includes radiocarbon dates, you may see uncalibrated or calibrated dates, or both.
Mass spectrometry
Measurement of 14C and 12C was originally done by beta-counting devices, which counted the amount of beta particles emitted by decaying 14C atoms. More recently has become the method of choice because it counts all the 14C atoms in the sample, not just the beta particles. Because it accounts for every atom 14C, it can be used with much smaller samples (as small as individual plant seeds), and gives results more quickly (Christie et al., 2018).

AMS counts the atoms of 14C and 12C in a given sample, determining the 14C/12C ratio directly. The sample, often in the form of graphite, is made to emit C− ions (carbon atoms with an extra electron, giving them a slight negative charge), which are injected into an accelerator. The ions are accelerated and passed through a stripper, which removes several electrons so that the ions emerge with a positive charge. The ions, which may have from 1 to 4 positive charges (C+ to C4+), depending on the accelerator design, are then passed through a magnet that curves their path; the heavier ions are curved less than the lighter ones, so the different isotopes emerge as separate streams of ions (Figure 16). A particle detector then records the number of ions detected in the 14C stream (Christie et al., 2018).
Radiocarbon dating is generally limited to dating samples no more than 50,000 years old. Samples older than this will have extremely small amounts of 14C present. Older dates have been obtained by using special sample preparation techniques, large samples, and very long measurement times to compensate for the challenge of measuring trace amounts of 14C. These techniques can allow measurement of dates up to 60,000 and in some cases up to 75,000 years before the present (Walker & Walker, 2005). is another form of mass spectrometry used by archaeologists to analyze isotopic ratios of nitrogen, 13C, strontium (Sr), and carbonate (CO3). These analyses do not produce absolute dates, but can assist in assigning ranges of relative dates or to make interpretations about ecological conditions at the time of formation (marine shell from prehistoric sites is a popular candidate for IRMS analysis).
Luminescence dating
Thermoluminescence can be used to date materials containing crystalline minerals to a specific heating event. This is useful for ceramics, as it determines the approximate date of firing, as well as for lava, or even sediments that were exposed to substantial sunlight. Natural background radiation creates defects in the molecular crystal structure, which traps electrons. Electrons can be released from the crystalline traps by stimulating them with external energy, producing , or spontaneous light. Thermoluminescence (TL) involves heating samples, while optically stimulated luminescence (OSL) involves exposing samples to high intensity light (Beck, 1994).
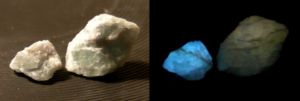
The longer the crystals are affected by this radiation the more electrons are trapped. Archaeologists and geologists calculate the age of a sediment sample based on the time since the sample was last exposed to sunlight or intense heat. Sunlight bleaches away the luminescence signal and resets the time ‘clock’. The main minerals used in luminescence dating are quartz and potassium feldspar, a common igneous mineral (USGS Luminescence Dating Laboratory, n.d.). The intensity of the luminescence varies depending on the amount of radiation absorbed when the mineral grains were buried, and specific properties of the mineral being stimulated (Figure 17).
Most luminescence dating methods rely on the assumption that the mineral grains were sufficiently bleached at the time of the event being dated. For example, for quartz crystals, a daylight exposure in the range of 1–100 seconds before burial is sufficient to “reset” the OSL dating clock (Rhodes, 2011). Also, ceramics must have been fired to at least 400°C, or 752° F (Seeley, 1975). The amount of light produced is a specific and measurable phenomenon. If the specimen’s sensitivity to ionizing radiation is known, the released thermoluminescence can be translated into a specific amount of time since the formation of the crystal structure. Because this accumulation of trapped electrons begins with the formation of the crystal structure, thermoluminescence can date crystalline materials to their date of formation; for ceramics, this is the moment they are fired (Beck, 1994). Single Quartz OSL ages can be determined for samples from 100 to 350,000 years BP (Murray & Olley, 2002).
Electron spin resonance
Like thermoluminescence dating, electron spin resonance dating is based on the measurement of accumulated background radiation from the burial environment. It is used on artifacts and rocks with crystalline structures, including tooth enamel, shell, and rock. The radiation causes electrons to become dislodged from their normal orbit. They become trapped in the crystalline matrix and affect the electromagnetic energy of the object. This energy can be measured and used to estimate the length of time in the burial environment. This technique works well for remains as old as two million years (Carvajal et al., 2011). It has the added benefit of being nondestructive, which is an important consideration when dealing with irreplaceable material (King & Zajicek, 2019).
Potassium-Argon (K-Ar) and Argon-Argon (Ar-Ar) Dating
Radiocarbon dating does not work on materials because there is no viable organic material left in the sample, but several other types of radiometric dating can be used to determine the age of rocks formed around a fossil. Through the process of radioactive decay, potassium-40 () decays to argon-40 () gas, which gets trapped in the crystalline structures of volcanic minerals. When a potassium-bearing mineral is crystallizing, 40Ar atoms are not normally trapped within the growing crystal. However, once the crystal is formed, 40K trapped within the crystal lattice begins to decay into 40Ar. This means that all of the 40Ar measured in a sample came from the decay of 40K trapped within the crystal. By plugging the amounts of 40K and 40Ar found in the crystal into a special algebraic equation, researchers can estimate the age of the rock or mineral (McDougall & Harrison, 1999).
Argon-Argon (Ar-Ar) dating uses the same principles, the difference being that the ratios of 40Ar and are compared instead of determining absolute quantities. This is accomplished by neutron irradiation from a nuclear reactor to convert a stable form of potassium () into the radioactive argon-39 (39Ar) gas. The advantage of this method is that a smaller sample is needed. Another advantage is the analysis is performed after one exposure to the nuclear reactor. In comparison, K-Ar dating requires an extra step for the potassium isotopes to be counted, and then the sample is run again to get a count on the argon (McDougall & Harrison, 1999). Multiple “runs” through a nuclear reactor degrades the sample and can introduce error.
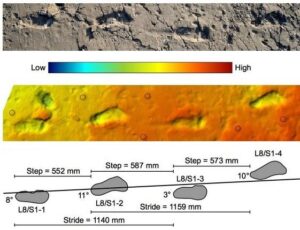
One of the most well-known applications of K-Ar dating in paleoanthropology is the dating of the Laetoli Footprints in modern-day Tanzania. Laetoli is a site in the nation of Tanzania, dated to the Plio-Pleistocene and famous for its hominin footprints preserved in volcanic ash (Figure 18). Based on the results of K-Ar dating on mineralized ash, a group of three Australopithecus afarensis made the trek through raining ash, followed by a cooling rain, about 3.7 million years ago. Footprints from other animals were also preserved and are dated to the same period. By combining relative and radiometric dating techniques, paleoanthropologists were able to confidently assign this ancient date, drastically improving our understanding of our primate predecessors.
Ethical considerations
It’s safe to say that over time, the dating methods used by archaeologists have become more complicated, requiring more advanced techniques and instruments to gather data. Archaeologists rarely work in isolation. A project will involve archaeologists specializing in special dating techniques, or the help of technicians who will generate the data that the archaeologist will then use to analyze the site. Extremely technical sample preparation processes and instrumental analysis that was only used by geologists, biologists, and other natural scientists is now being integrated into archaeological analysis. This has also opened the door to researchers from other nations who are now able to collaborate in real time using the internet.
While this has elevated the public perception of archaeologists and what they are able to learn from past societies, it has also created ethical issues, especially when it comes to analyzing human remains and objects removed from burials. Laboratory analyses are sterile and abstract methods for understanding the past, in comparison to traditional stories, customs, and beliefs. In many nations, the archaeologist is also responsible for complying with laws governing human remains. An archaeologist who discovers a burial may be excited to conduct as many analyses as possible on the items in the burial and what remains of the person, but this might not sit well for descendants of the person buried. More details regarding appropriate treatment of human remains and burial objects can be found in the Bioarchaeology chapter of this text.
Discussion Questions
- Archaeologists have many ways to determine the possible age of a site, artifact, or ecofact. Consider the many types of dating methods that can give scientists a specific age. Which ones might best apply to the following, and why?
- a wooden lintel, or panel over a door
- a stela with a date in Mayan numerals carved into it
- human remains that are obviously not from a recent burial
- a ceramic pot with residue from plants inside of it
- a set of fossilized footprints found in association with remains of an animal that became extinct 2 million years ago
- Relative dating methods are used to place an object in a particular cultural sequence based on style, shape, and appearance. They can pose special challenges for archaeologists that other methods providing specific dates do not. What might be a challenge of a relative dating method that some of the other dating methods presented in this chapter that give more specific, absolute dates? Explain why it might be a challenge. Why might an archaeologist choose to go with this relative dating method anyway?
About the Author
When Kaitlin turned 17, she participated in her first archaeological field school at Mission San Antonio de Padua in central California. Since then, she has been a part of field work focusing on pre-colonial lifeways in Ecuador, Utah, California, and Oregon. In 2015, she completed a Master of Arts degree in Applied Anthropology from Oregon State University (go Beavs!) with a minor in Geosciences. Kaitlin has taught Anthropology and Sociology courses as adjunct faculty at Klamath Community College and Oregon Tech in Klamath Falls. Now she is running a cultural resources consulting firm serving central and southern Oregon. When she isn’t working on a project, she enjoys spending time with friends and family, making arts and crafts, and working in the garden.
References
Balter, M. (2010, June 17). New Dates for Egypt’s Pharaohs. Science News. https://www.science.org/content/article/new-dates-egypts-pharaohs doi: 10.1126/article.30297
Beck, C. (Ed.). (1994). Dating In Exposed And Surface Contexts. University of New Mexico Press.
Carvajal, E., L. Montes, and O. A. Almanza. (2011). “Quaternary Dating by Electron Spin Resonance (ESR) Applied to Human Tooth Enamel.” Earth Sciences Research Journal 15(2): 115–120.
Christie, M. (2018). “Radiocarbon dating.” WikiJournal of Science, 2018, 1(1):6 doi: 10.15347/wjs/2018.006. Encyclopedic Review Article
Clelland, S.‐J., Wilson, M.A., Carter, M.A. & Batt, C.M. (2015). RHX dating: the activation energy of rehydroxylation. Archaeometry, 57: 392-404. https://onlinelibrary.wiley.com/doi/10.1111/arcm.12118
Cook, S. F., and H. C. Ezra-Cohn. 1959. “An Evaluation of the Fluorine Dating Method.” Southwestern Journal of Anthropology 15(3): 276–290.
Cristiani, E., Radini, A., Borić, D., Robson, H.K., Caricola, I., Carra, M., Mutri, G., Oxilia, G., Zupancich, A., Šlaus, M., Vujević, D. (2018). Dental calculus and isotopes provide direct evidence of fish and plant consumption in Mesolithic Mediterranean. Scientific Reports 8(8147). https://doi.org/10.1038/s41598-018-26045-9
Crow Canyon Archaeological Center, n.d. Science & Technology in Archaeology: Palynology, https://www.crowcanyon.org/palynology/.
De Groote, Isabelle, Linus Girdland Flink, Rizwaan Abbas, Silvia M. Bello, Lucia Burgia, Laura Tabitha Buck, Christopher Dean, et al. 2016. “New Genetic and Morphological Evidence Suggests a Single Hoaxer Created ‘Piltdown Man.’” Royal Society Open Science 3: 160328.
Halligan, J., Waters, M., Perrotti, A., Owens, I., Feinberg, J., Bourne-Worster, M., Fenerty, B., Winsborough, B., Carlson, D., Fisher, D., Stafford Jr., T. & Dunbar, J. (2016). Pre-Clovis Occupation 14,550 Years Ago At The Page-Ladson Site, Florida And The Peopling Of The Americas. Science Advances. 2. e1600375. 10.1126/sciadv.1600375.
Hakanson, K. (2022). Chart showing a comparison of the most common abbreviations seen in archaeological dating. Original work. Creative Commons license. Data in chart from Gangal K, Sarson GR, Shukurov A (2014) The Near-Eastern Roots of the Neolithic in South Asia. PLOS ONE 9(5): e95714. https://doi.org/10.1371/journal.pone.0095714, Neha Srivastava Karve. “BC and AD vs. BCE and CE: How to Use Correctly”. The Editor’s Manual. https://editorsmanual.com/articles/bc-ad-bce-ce/, https://en.wikipedia.org/wiki/Common_Era
Henri Becquerel – Facts. NobelPrize.org. Nobel Prize Outreach AB 2021. Sat. 11 Dec 2021. https://www.nobelprize.org/prizes/physics/1903/becquerel/facts/ from Nobel Lectures, Physics 1901-1921, Elsevier Publishing Company, Amsterdam, 1967.
King, S.S. & L. A. Zajicek. (2019). Understanding the Fossil Context in Explorations, an Open Invitation to Biological Anthropology. Beth Shook, Katie Nelson, Kelsie Aguilera, and Lara Braff, Eds. https://pressbooks-dev.oer.hawaii.edu/explorationsbioanth/chapter/__unknown__-7/
McDougall, I., and Harrison, T.M., (1999). Geochronology and thermochronology by the 40Ar/39Ar method: New York, Oxford University Press, xii, 269 p.
Montgomery, C. & D. Dathe (1994). Earth: Then and now. 2nd Ed. Wm. C. Brown Publishers
Montgomery, K. (2003). Siccar Point and Teaching the History of Geology. Journal of Geoscience Education. 51. 500-505. 10.5408/1089-9995-51.5.500.
Marean, Curtis W.; Bar-Matthews, Miryam; Bernatchez, Jocelyn; Fisher, Erich; Goldberg, Paul; Herries, Andy I. R.; Jacobs, Zenobia; Jerardino, Antonieta; Karkanas, Panagiotis; Minichillo, Tom; Nilssen, Peter J. (Oct 18, 2007). “Early human use of marine resources and pigment in South Africa during the Middle Pleistocene”. Nature. 449 (7164): 905–908. doi:10.1038/nature06204. ISSN 0028-0836\
Marie Curie – Biographical. NobelPrize.org. Nobel Prize Outreach AB 2021. Tue. 28 Dec 2021. <https://www.nobelprize.org/prizes/physics/1903/marie-curie/biographical/> from Nobel Lectures, Physics 1901-1921, Elsevier Publishing Company, Amsterdam, 1967.
Marra, J. F. (2019). Hot Carbon: Carbon-14 and a Revolution in Science. United States: Columbia University Press.
Murray, A. S. & Olley, J. M. (2002). “Precision and accuracy in the optically stimulated luminescence dating of sedimentary quartz: a status review” (PDF). Geochronometria. 21: 1–16. http://www.geochronometria.pl/pdf/geo_21/geo21_01.pdf. Retrieved Jan 22, 2022.
New Scientist, 1990. The day the Sweet Track was built”. https://web.archive.org/web/20100311232408/http://www.newscientist.com/article/mg12617212.800-science-the-day-the-sweet-track-was-built.html
Rhodes, E. J. (2011). “Optically stimulated luminescence dating of sediments over the past 250,000 years”. Annual Review of Earth and Planetary Sciences. 39: 461–488. doi:10.1146/annurev-earth-040610-133425.
Seeley M-A. (1975). Thermoluminescent dating in its application to archaeology: A review. Journal of Archaeological Science 2(1):17-43. https://www.sciencedirect.com/science/article/abs/pii/0305440375900448
Trigger, B. (2007) A History of Archaeological Thought (2nd ed.) New York: Cambridge University Press.
Walker, M. J. C., Walker, M. (2005). Quaternary Dating Methods. United Kingdom: Wiley.
USGS Luminescence Dating Laboratory (n.d.) Luminescence Dating: Capabilities. US Geological Survey, Department of the Interior. https://www.usgs.gov/labs/luminescence-dating-laboratory/luminescence-dating-laboratory. Accessed 12.11.2021.
An object that was made and used by humans in the past.
Rock and mineral fragments
Information with a value that can be measured or counted (quantified), and have a distinct numeric value; contrasts with qualitative data, which refer to information that observed, characterized, described, and recorded but not quantified.
A person who studies or collects antiques or antiquities.
Assigning an object to a cultural period based on its color, size, or shape.
Orally transmitted stories and other cultural information that are collected through ethnography.
Dating methods based on the radioactive decay of isotopes, such as Carbon-14 or Potassium-40. By knowing the rate of decay for a radioactive element, researchers can determine the age of artifacts, structures, and stratigraphic layers.
(before common era/common era) - notation for reporting ages that moves away from the BC/AD date notation used by the Christian/Gregorian calendar. This is a more inclusive way of reporting dates that is recognized internationally.
(calibrated years before present) - correct notation for radiocarbon dates that are adjusted to account for reservoir effect, sample contamination, isotopic fractionation, and other natural effects that introduce error in the calculation of radiocarbon age
A timeline of the natural events that have affected the Earth since the planet was formed, going back billions of years.
A timeline of the natural events that have affected the Earth since the planet was formed, going back billions of years (synonymous with Geologic Time)
The idea that if you choose one specific patch of soil, and you dig down through the different layers, the layers at the bottom of your hole were deposited first.
All species, including side-branches and extinct species, on the human evolutionary line.
A branch of paleontology and anthropology which seeks to understand the early development of anatomically modern humans.
A period of time that is characterized by certain types and styles of artifacts; used to estimate a relative date.
Relative dating method in which artifacts from multiple sites are placed in chronological order.
A specific type of artifact that marks a specific period of time in the archaeological record.
In Anthropology, a person who provides specific information about a research topic.
An unofficial unit of geologic time used to describe the most recent period in Earth’s history, when human activity, specifically nuclear weapon detonation, started to have a significant impact on the planet’s climate and ecosystems.
Information or data that is not easily described with numbers.
Methods of analysis that use a piece of scientific equipment (other than the human senses) to gather data. Mass spectrometers, microscopes, radiation detectors, cameras, scales, and computers are all scientific instruments.
Atoms of elements that emit energy and particles as they decay into other elements.
One of two or more forms of the same element that differ in the number of neutrons in the nucleus.
the process through which the nucleus of a radioactive isotope loses energy and emits particles in an attempt to become stable
The length of time required for half of a given number of atoms of that isotope to decay.
A graph showing the speed of radioactive decay, calculated using statistics and principles of nuclear physics.
carbon-14, notation for isotope of carbon, the most commonly used element for determining the age of organic materials in archaeology
carbon-12, notation for isotope of carbon, the most commonly used element for determining the age of organic materials in archaeology
A term for describing how “off” a scientific measurement is.
Instrumental method for calculating age that uses a mass spectrometer.
A form of mass spectrometry used by archaeologists to analyze isotopic ratios of nitrogen, 13C, strontium (Sr), and carbonate (CO3).
Spontaneous emission of light by a substance.
an organism that is preserved against natural decay processes, usually through petrification
notation used for potassium-40, used in dating rocks, minerals, and fossils
notation used for argon-40, used in dating rocks, minerals, and fossils
notation used for argon-39, used in dating rocks, minerals, and fossils
notation used for potassium-39, used in dating rocks, minerals, and fossils
