Archaeological Surveys and Remote Sensing
Note – We are currently beta testing this textbook. If you are a student who has been assigned this reading, we would appreciate any feedback you may have. After finishing the chapter, please go to https://forms.gle/3QDm5QYi4ft4wbnXA to complete a short survey.
Ian S. Ray, Ph.D., Colorado Department of Education
Learning Objectives
Students will be able to:
● Define and describe archaeological surveys, GIS, and Remote Sensing.
● Identify the interdisciplinary sciences needed to collect usable geospatial data from pedestrian surveys and public datasets.
● Analyze the use of GIS and related technologies and suggest situations where specific applications would be needed.
● Explore the use of GIS within specific archaeological projects.
In 2011, James had just graduated from the University of Colorado at Colorado Springs with a degree in archaeology. His first professional job was with a CRM firm with the title “Staff Scientist”. The best part of the job? In his words, the best part was getting to say “We’ve got to get this back to the lab!” But, how did James find the artifacts and what did he do with the information once his analysis was done? (Some may also wonder, how did he survive the eye-rolls from the rest of the survey team when he yelled this for the fifth time in 10 minutes?) The answer, at least to the first question, is by conducting surveys and then using the geospatial data to provide the clients with a robust analysis of what areas were safe to begin construction and which needed more investigation to comply with federal, state, and local laws.
Archaeological surveys are used to identify potential sites, locate artifacts, and provide the raw data for more complex interpretations. For example, finding similar artifacts across a large geographic area can help us to figure out what ancient trade networks might have been used, how ancient economies functioned, or how people were using lands. Traditional surveys, more commonly known as pedestrian surveys, require physical presence at a location and specific techniques in looking for artifacts on the surface of the ground. These surveys are vital to the entire process of site identification and excavation. However, surveys alone are not sufficient to get an idea of what might be present. Instead, archaeologists have long relied on mapping of these individual artifacts to determine the extent of the site . Modern technology has allowed for the integration of survey data into larger archaeological workflows, giving us much greater speed, precision, and accuracy even when full excavations are not possible or the extent of an archaeological site is not know.
Geographic Information Science (GIS) is not a single method, concept, or program. Instead it is a way of organizing, displaying, and analyzing data that has some type of geospatial component. This interdisciplinary science has been applied to fields from ethnography to urban planning, wildlife management to mining, and economics to anthropology, among others . In today’s world, GIS is intimately tied with Remote Sensing (RS), a nearly magical method of collecting data without being physically present at a location.
This chapter will examine the uses of GIS and RS in the field of archaeology and demonstrate how they complement more traditional methods of surveying and mapping. Not only can these techniques be used to understand past peoples, but they can help us preserve the cultural heritage we have inherited from past generations. We can use these techniques to analyze ancient trade routes, avoid destroying sites during development, and even predict the precise location of previously undiscovered sites.
Surveys, Software, and Statistics
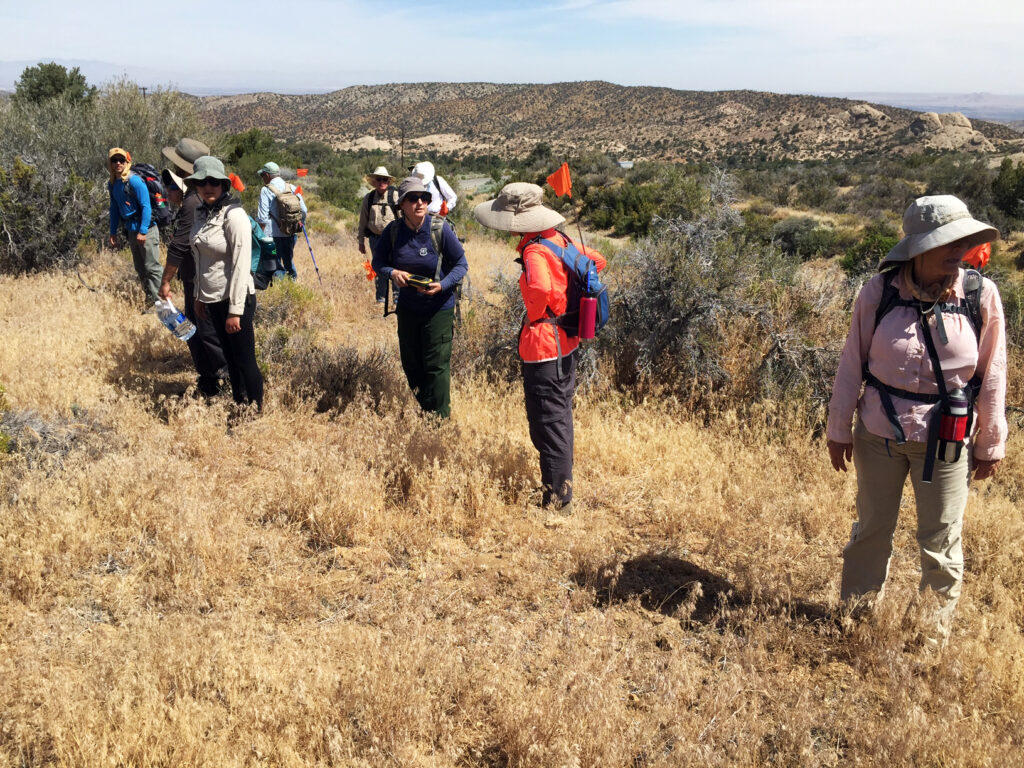
Pedestrian surveys are a cornerstone of archaeology. These surveys rely on large teams of archaeologists and volunteers to walk a site in a specific pattern. Generally, individuals start by lining up at one end of an area of interest, approximately two meters (six feet) apart (Figure 1). However, the exact distance between individuals depends on the research design, the amount of ground cover (plants, snow, etc), and logistics of the project. CRM projects will generally need to be conducted on a tight budget with limited time, so their pedestrian surveys may use a spacing of 10 to 20 meters, depending on the requirements of the state. On the other hand, a well-funded excavation at a known (and protected) archaeological site will stick to the two meter rule, since the cost-benefit tradeoff is less of a concern – the researchers ‘know’ they will find important artifacts. The team then slowly walks across the field together, carefully scanning the ground for any potential artifacts. Anytime something is found, the team will pause while the item is examined, GPS coordinates are taken, and the item is “tagged and bagged ”. This involves completing a standardized form that includes information like the date, GPS coordinates, individual who identified the object, and any contextual information that may be relevant (see these forms from the University of Arkansas).
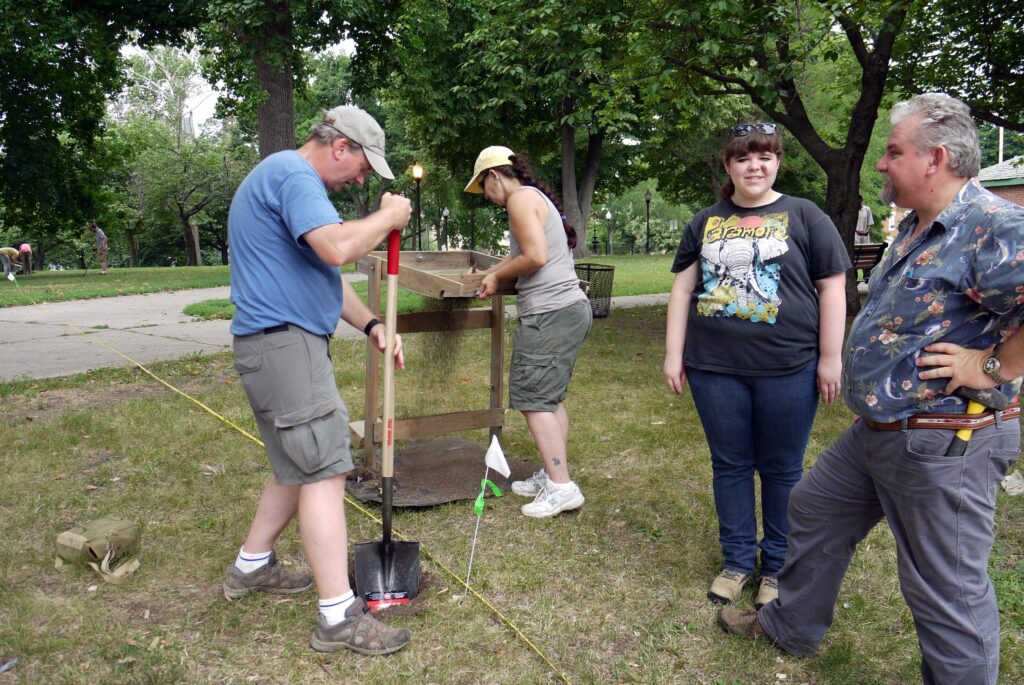
Pedestrian surveys are accompanied by systematic locations of shovel test pits (STP ). These are generally laid out in a grid pattern over the area where pedestrian surveys have been completed. As the name implies, shovels (or other excavation tools) are used to dig test holes, regardless of whether artifacts have been found. Test pits are generally around 30 to 50 cm in diameter and up to around 1m in depth, though the specifics of the site and likely age of artifacts can require changes to these general guidelines (Figure 2). This allows the researchers to systematically assess where (and if) further excavation is needed. Within the CRM context, STPs are only used in areas where the pedestrian surveys were obscured by ground cover (like plants or snow), since digging takes time and can increase the length of the project.
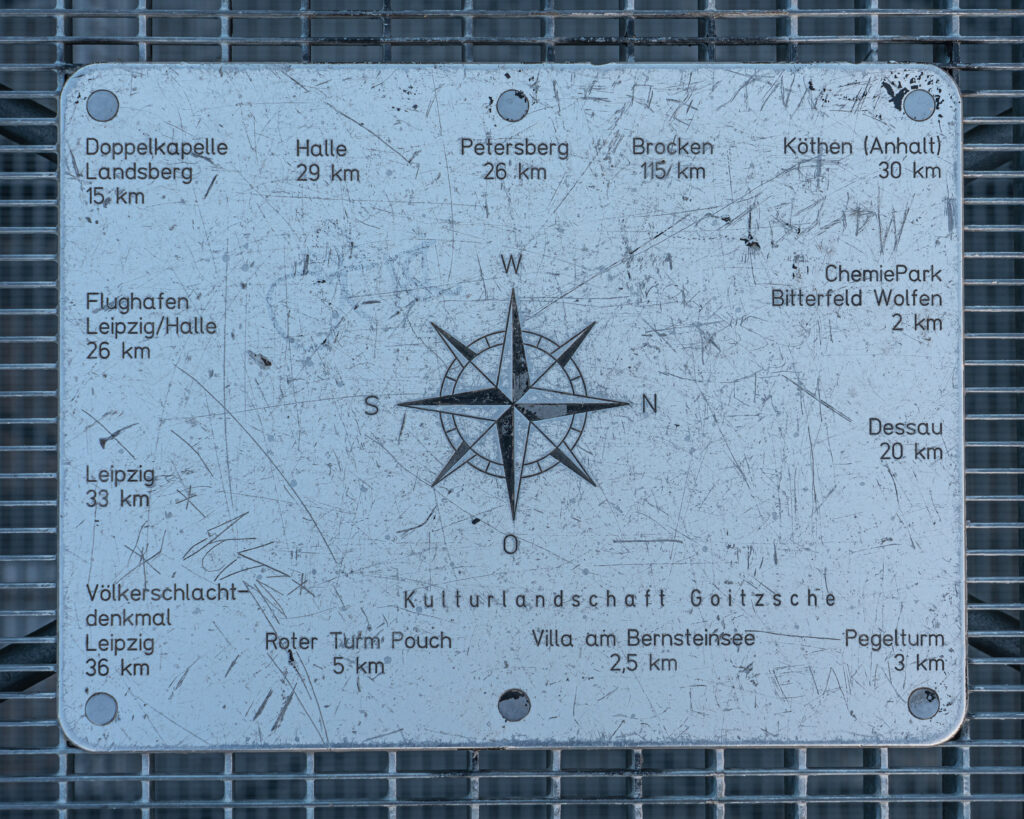
Mapping is an essential skill for any archaeologist, both interpreting maps made by others and creating them ourselves . The first step to reading a map prepared by a professional map maker (cartographer) is to determine the directions displayed. This is called orientation and typically is accomplished by finding the arrow pointing north (or a compass rose, see Figure 3). Fun fact – north being “up” is not the only way maps have been made throughout history. Historic maps tended to use east as “up”. The term orientation comes from “The Orient”, which is east from a European perspective. The next step to reading a map is to determine the scale, or amount the representation of the real world has been shrunk. For example, on a 1cm:100m scale, each one centimeter on the printed map represented 100 meters of the real world .
Rough hand maps are typically made during any survey and help the archaeologists to envision what is occurring at the site. These are often digitized, either by snapping a photo of the hand-drawn map or using Google Images or MS Paint to recreate the hand-drawn map (for a great example of this, see Figure 2 in Cultural Resource Management and Archaeology: Conserving Heritage). Few archaeologists are also artists, so our hand maps tend to be very rough and not to scale. They are vital for field notes and keeping track of what is occurring during any survey, but thankfully technology can help make our rough sketches more accurate and presentable to others (see the ArcGIS and QGIS section below).
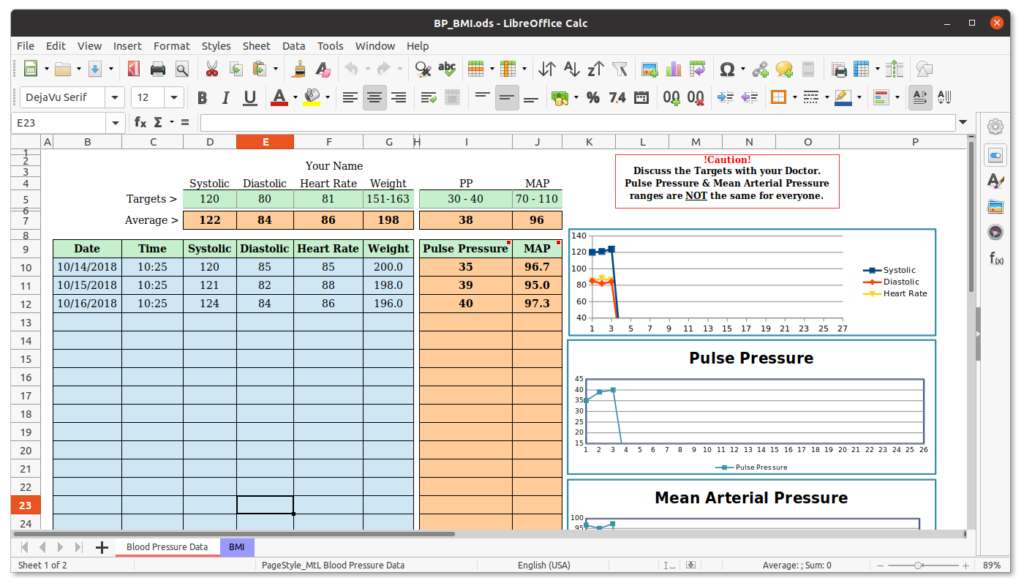
Once the data from surveys and STPs are collected, and any artifacts appropriately curated, modern archaeologists then go about converting the pen-and-paper records into digital records. Most of the time, this requires inputting all the information into a spreadsheet, like a Microsoft Excel or LibreOffice sheet, but some archaeologists prefer adding things to Google Sheets (Figure 4). Eventually, these files are compiled into entire databases, such as with Microsoft Access or OpenOffice Base (but those details are best left to data scientists, not archaeologists). Regardless of the specific program used, the data must be entered in specific columns and generally needs to be in numeric format (so that the spreadsheet can be easily used with other programs – discussed in the following paragraphs).
Statistical Software
Statistical analyses are needed for most archaeological work. This can take a variety of forms, from identifying differences in surface features to finding small changes in the frequency of artifacts (see the Ancient Technologies and Ancient Environment chapters for more on this). If you’re not comfortable doing math by hand, don’t worry! That’s why archaeologists put data into spreadsheets – so the computer will do the math for us.
Two of the most common statistical programs used by researchers are SPSS and PSPP. SPSS stands for the “Statistical Package for the Social Sciences” and is offered by IBM. SPSS subscriptions are quite affordable while attending college (around $80 per year), but quickly skyrocket for professionals (around $100 per month). To avoid this, and to ensure equity for people of all income levels, many professionals switch to open-source alternatives. PSPP isn’t a fancy acronym, but instead a play on SPSS. PSPP offers most of the common features of SPSS, including a graphical interface and options for coding more advanced statistics, but without any financial investment ! In fact, you can download PSPP right now, for free, from https://www.gnu.org/software/pspp. The open software movement is vital to creating a more equitable research environment, as are any efforts that make research activities more widely available for both the producers and consumers of knowledge.
Another common approach is to use R and RStudio. R is a programming language developed for statistical analyses and is used by RStudio to run many statistical tests. RStudio provides a GUI (Graphical User Interface), but still requires knowledge of how to write code in R. For more on how R and RStudio work, see the official RStudio website.
Geospatial Software
Once the data are in spreadsheets and have run any statistics needed, the next step is to put the data into a Geographic Information System. Geographic Information System refers specifically to the programs used to conduct Geographic Information Science. Since the two are so tightly linked, most professionals use the term GIS to refer to both the science and the software.
The two most common GIS programs used are ArcGIS and QGIS. Just like with SPSS and PSPP, one requires a paid subscription while the other is free and open-source. ArcGIS is the industry standard (and priced accordingly), while QGIS is the open-source alternative. Both systems work best with data in .csv format, but any spreadsheet format can be used. Data must be imported into the program and specific tools run to convert the raw data into spatial data, most often using GPS or other spatial data from the pedestrian surveys. These tools create a layer, or an overlay of data onto a background, for us to visually inspect. See the Working With Spreadsheets and QGIS box for an example of how this is done in QGIS.
Once we have the data into our GIS program and created the layer of our data, we can start mapping out the archaeological site. Archaeologists often create multiple maps to display the information in different ways for different audiences and to highlight different findings. For example, it might be important to show the path of the pedestrian survey on one map and the number of artifacts found in each STP on another map. The process of creating maps showing specific information is called cartography. The principles of cartography are beyond the scope of this chapter, but an example kind of maps created are presented in the Working With Spreadsheets and QGIS box.
GIS programs are not only used for creating pretty maps – they are much more powerful than that. For example, each program has a wide array of tools that can be used to do things like plan new pedestrian surveys, create buffers around features like houses or roads, or analyze the topography of an area to predict where artifacts might be located. Unlike in past decades, this last use of GIS programs is now intimately tied with aircraft and remote sensing.
Working With Spreadsheets and QGIS
This section demonstrates how to use open-source data and QGIS to create a map of archaeological finds. In this example, data were obtained from Open Context (https://opencontext.org/) regarding the location, amount, and type of archaeological finds.
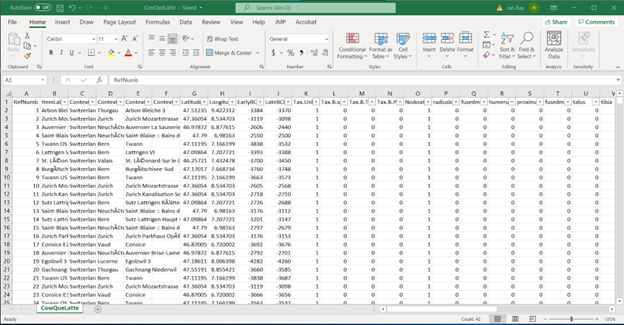
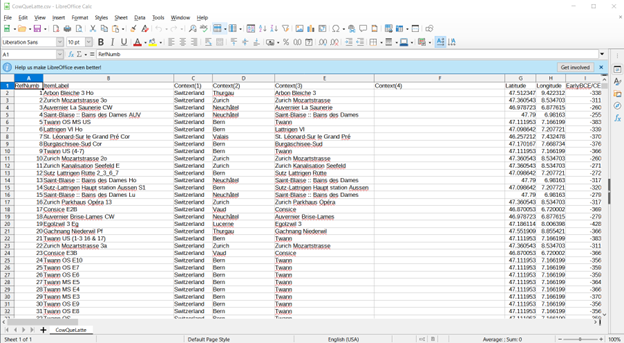
This first pair of images shows the CowQueLatte spreadsheet open in Microsoft Excel and LibreOffice Calc. In both programs, the data is identical – it’s only the display that differs between the programs. Whenever using data, it’s best to open the file in a spreadsheet viewer (MS Excel, LO Calc, or Google Sheets) to check that the data are correct and accurate.
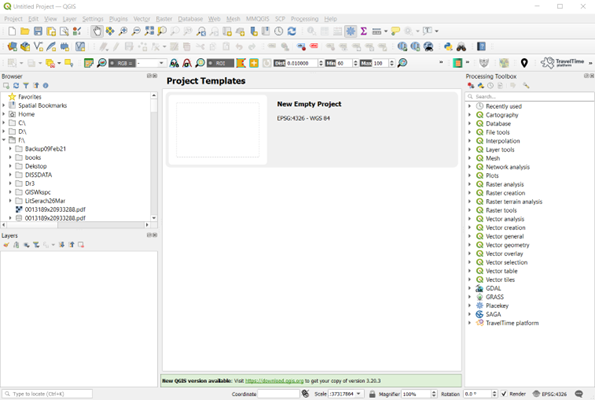
The next step, after ensuring the .csv file contains the correct data, is to open QGIS. This image represents the QGIS home page when first opening the program. For this example, the chapter author selected “New Empty Project”.
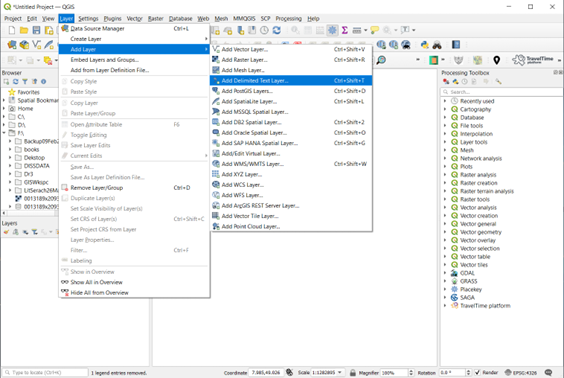
Now that a QGIS project has been started, we need to add the data (from the CowQueLatte.csv spreadsheet) to our QGIS project. This is done by selecting Layer -> Add Layer -> Add Delimited Text Layer.
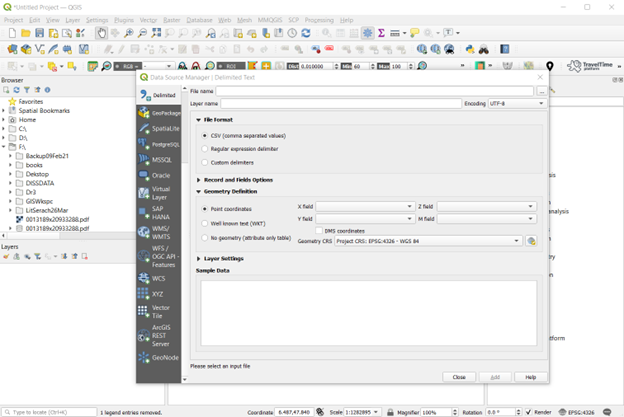
Clicking on “Add Delimited Text Layer” brings up the “Data Source Manager” pop-up box set to the “Delimited Text” option on the left-hand side. This allows us to select “CSV” as the file format before we select the CowQueLatte.csv file by clicking on the three dots after the long “File Name” box.
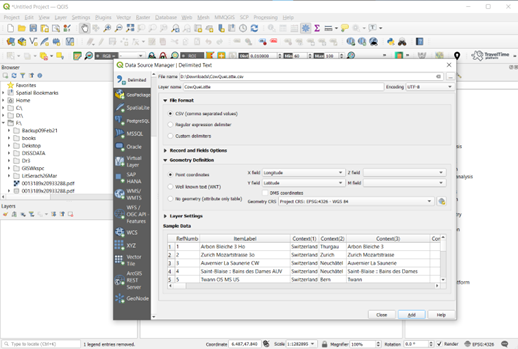
Selecting the “CowQueLatte.csv” file brings up additional options in the Data Source Manager box. We are mostly concerned with telling QGIS how and where the location of each archaeological find is stored in the spreadsheet. Fortunately, the “CowQueLatte.csv” file already has the Latitude and Longitude saved as specific columns. We can therefore just select “Longitude” in the X field and “Latitude” in the Y field. Remember – Longitude lines are numbered from East to West and West to East, while latitude lines are numbered from South to North and North to South.
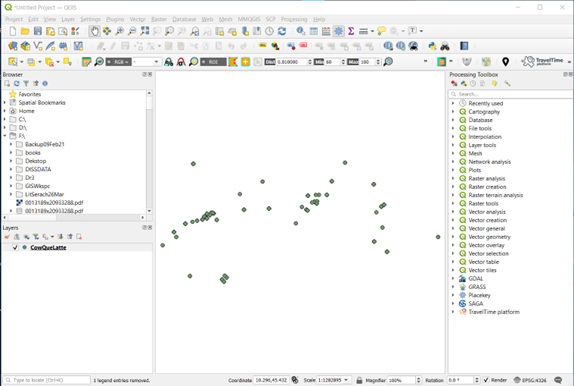
After clicking “Add”, QGIS now has the information to put a point at each latitude and longitude location where an artifact was found. QGIS converted our spreadsheet to a layer of points, with the layer title CowQueLatte in the bottom left corner.
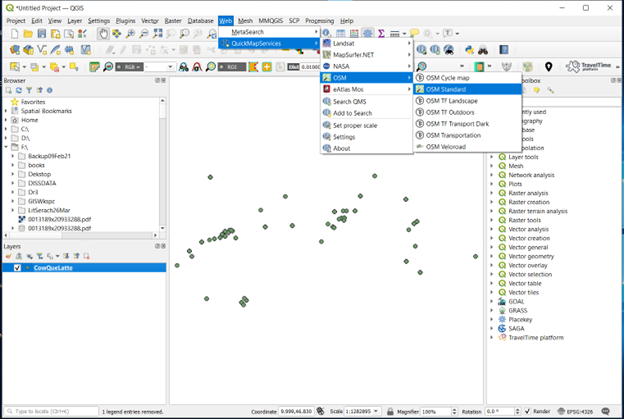
Having the location of each archaeological site is important, but so is having some kind of reference layer so that we can tell the artifacts don’t exist in a white void. To add a base layer, we can select Web -> QuickMapServices -> OSM -> OSM Standard.
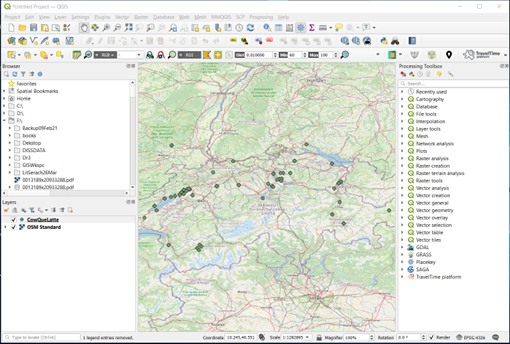
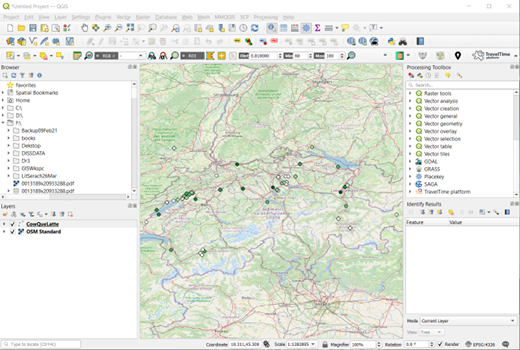
Adding the OSM Standard layer gives us a good reference for where each of these archaeological finds were located. The lower-right corner shows Milano (the Italian name for the city of Milan, Italy) while the center of the map shows Schweiz / Suisse / Svizzera / Svizra (the names for Switzerland in the official languages of German / French / Italian / Romansh, respectively).
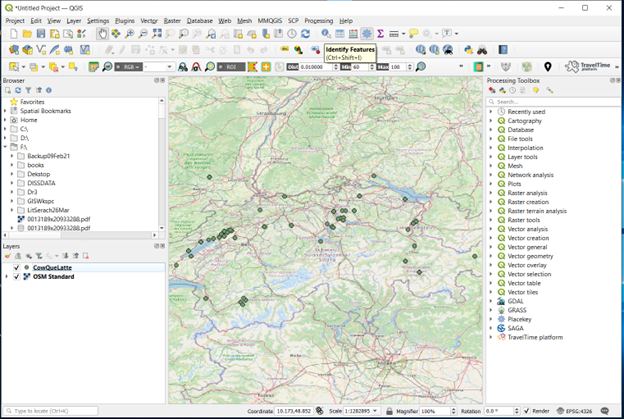
Now that we have all of the archaeological finds displayed and a reference layer, you might be wondering what happened to all the other information stored in the spreadsheet. We can see the data stored for each location by selecting the “Identify Features” button in the middle of the top ribbon under “Processing”, or by entering “Ctrl + Shift + I” on the keyboard.
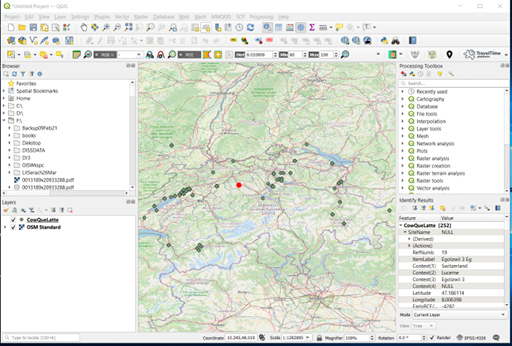
Clicking on any of the points will select the data for that one individual archaeological find. In this case, we have selected the site near the center of the screen. When we click on it, the color changes from green to red to let us know that we have selected that particular site. The bottom right corner of the screen also changes to show us all the data stored in the spreadsheet for that row.
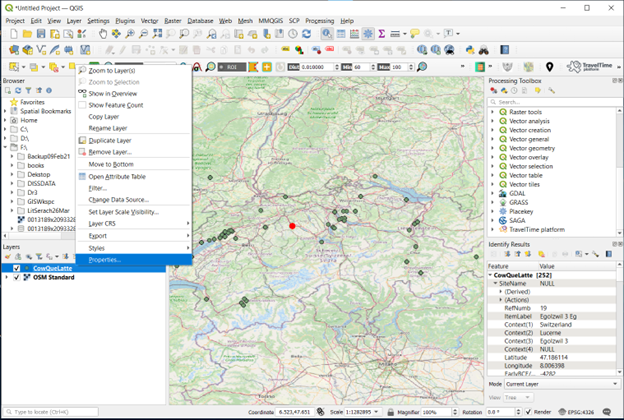
Now, let’s change how we see each of the sites visualized on the map. To do this, we right-click on the CowQueLatte layer we created in the bottom left corner of the screen. Then, we click on “Properties”.
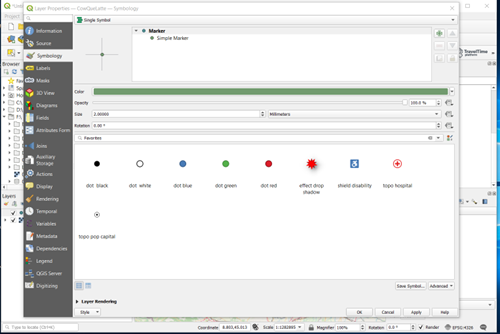
The “Layer Properties” pop-up window allows us to make many different changes to the selected layer. Right now, we’re only worried about changing how we see the locations represented on the map. This is called the layer’s “Symbology”. The layers have a single symbol by default, with a random color assigned by QGIS when we create the layer. In this example, the color is green, but it could be any color.
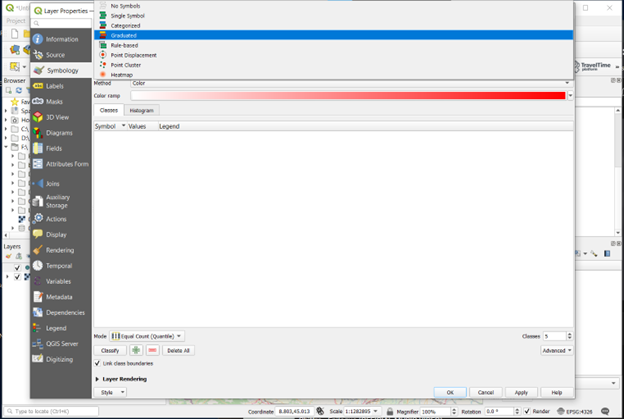
We often need to display more information than just the location of each archaeological site. For example, we might need to show when each site was occupied by people, how many artifacts were found, or what type of artifacts were found. In this example, we’ll change the color so that we can quickly see the latest age for each of the finds. This can be done by either changing the “Single Symbol” box to Graduated or Categorized. Graduated will bring up a continuous gradient, but won’t let us quickly group sites of similar ages together.
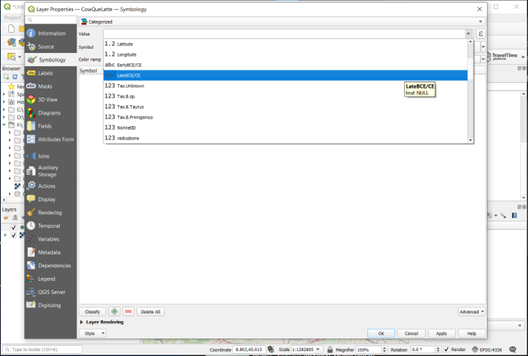
Instead, we select “Categorized” and then need to tell QGIS what “Value” we want the different symbols to be based on. In this example, we’re trying to show the most recent occupation of each site, so we’ll select the “LateBCE/CE” field.
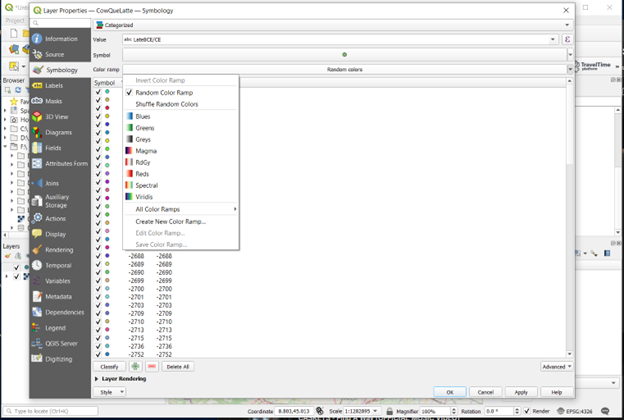
Now we have told QGIS that we are going to choose specific values of “LateBCE/CE” to show as different colors. QGIS has created a whole list of the possible values for “LateBCE/CE” and assigned each one a random color. Since we started off with all the sites shown in a green color, we’re going to change the “Color ramp” by clicking on the box that currently says “Random Colors” and selecting “Greens”. We also need to shrink down the number of categories QGIS is putting the “LateBCE/CE” values into by clicking on “Classify” in the lower left-hand corner. For our example, we decided to classify 5 categories of “Late BCE/CE”.
Once the color ramp is set to green and five classes have been set up, we click “Apply” and can see this map. You can see that each point is now one of five colors, giving us this view.
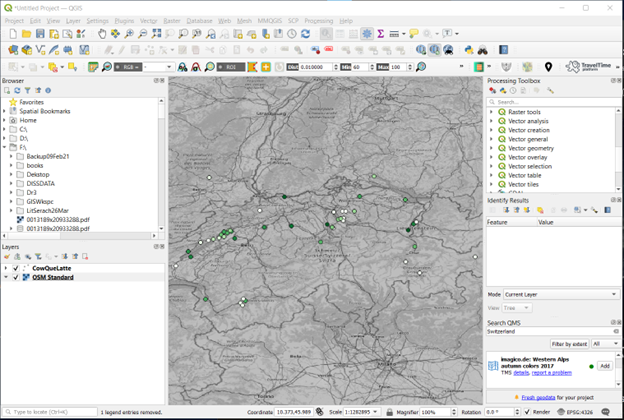
Before we finish our map, we need to change the OSM Standard layer. The green values are fine by themselves but can easily be lost in the green background. For this, we just right-click on the “OSM Standard” and change the view to black-and-white.
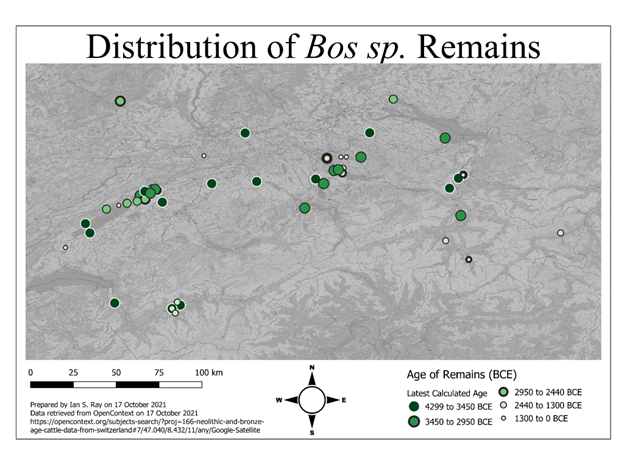
There are a number of additional steps we can take in QGIS to create a full map (via the Project – New Print Layout options). The details of how to do this can be found elsewhere, but we are able to create this map showing the latest calculated age of each archaeological find.
Aerospace, Aircraft, and Archaeology
None of the GIS programs could work without advances in aerospace engineering. Specifically, the Global Positioning System (GPS) satellites allow anyone to map the world around them down to the meter mark, with some systems allowing for millimeter accuracy (<0.04 inches). Those in use by the general public, such as the device you may be using to read this textbook, are somewhat less accurate at approximately 5m (16 feet). The accuracy may be increased substantially if there are multiple systems running at once or decreased if there are environmental hazards, such as buildings, mountains, or trees.
GPS satellites are run largely by the national governments of the world, though private companies are beginning to enter the market as well. These systems are therefore more accurate in countries with ties to the programs, such as in the United States. Unfortunately, there are often fewer satellites for use in remote areas or in the Global South, resulting in less accuracy in these areas.
Other satellite programs are in use to continually map the world around us. One particularly useful program is the Landsat program, run by the United States’ National Aeronautics and Space Administration (NASA) and the United States Geological Survey (USGS). The ninth iteration of this program was fast-tracked for launch in September of 2021 and ensures the continued creation of publicly-available data. In fact, you could use this link to register for an account and download the data for the area you’re sitting in right now.
If you were to download this image, however, you would immediately find that you couldn’t see yourself or necessarily make out the features of your immediate environment. Instead, you would find that each pixel represents an area of 900m2(~1075ft2), or around 100ft2 larger than the average apartment in the US. This resolution is not particularly useful for identifying tiny features, like individual homes or people, but is excellent for getting an idea of the groundcover or geographic features of a large area.
Atmospheric distortions, like clouds, wind, or air currents, make greater resolution very difficult . Light must pass through the atmosphere twice, once to reach the ground and once to reflect off the surface and then a second time to reach the satellite in orbit. Even tiny changes in air pressure, temperature, or wind speed can bend the light enough to make a high resolution image impossible to obtain. Unfortunately, satellites cannot stop and wait for conditions to improve; they must continue their orbital fall around Earth.
Improvements in other areas of technology, however, have allowed us to bring the satellites much closer to home. Aerial images were in use long before the first artificial satellite, the USSR’s Sputnik, was launched into orbit. Images from airplanes and helicopters allow for much greater resolution and ease of access , since it is much cheaper and easier to fly a plane than a rocket. Archaeologists have long used aerial photography to map sites, conduct surveys, and even to make the famous discovery of the Nazca lines (Kosok, 1959; Ruggles & Saunders, 2012). The USGS’s EROS archive contains aerial images covering the entire continental United States with each pixel equating to approximately 1m (3.28ft) (USGS, n.d.) . Specific flights and projects have frequently reduced the pixel size to approximately 15cm (5.90in) (USGS, n.d.) . Unfortunately, the utility of this type of aerial imaging is limited due to the relatively high cost of chartering airplanes and the potential distances of many sites from civilian airports.
Regulations, Radar, and Remote Sensing
The past 20 years have seen the rise of Unmanned Aerial Vehicles (UAVs), also known as drones or Unmanned Aerial Systems (UAS). The smaller size of UAVs means that they consume significantly less fuel than a full-sized airplane, with many models running only on battery power. This reduction in fuel needs means much cheaper, more frequent imaging that can be tailored to specific needs. Even better for those in the United States, the Federal Aviation Administration (FAA) has created a special type of pilot license for professional UAV pilots (see Figure 6). By using this type of license, anyone over the age of 16 can fly a UAV and gather their own imagery. This is often called a “Part 107” pilot license, referring to a specific federal code that allows these pilots to fly UAVs, but not manned aircraft like planes or helicopters.
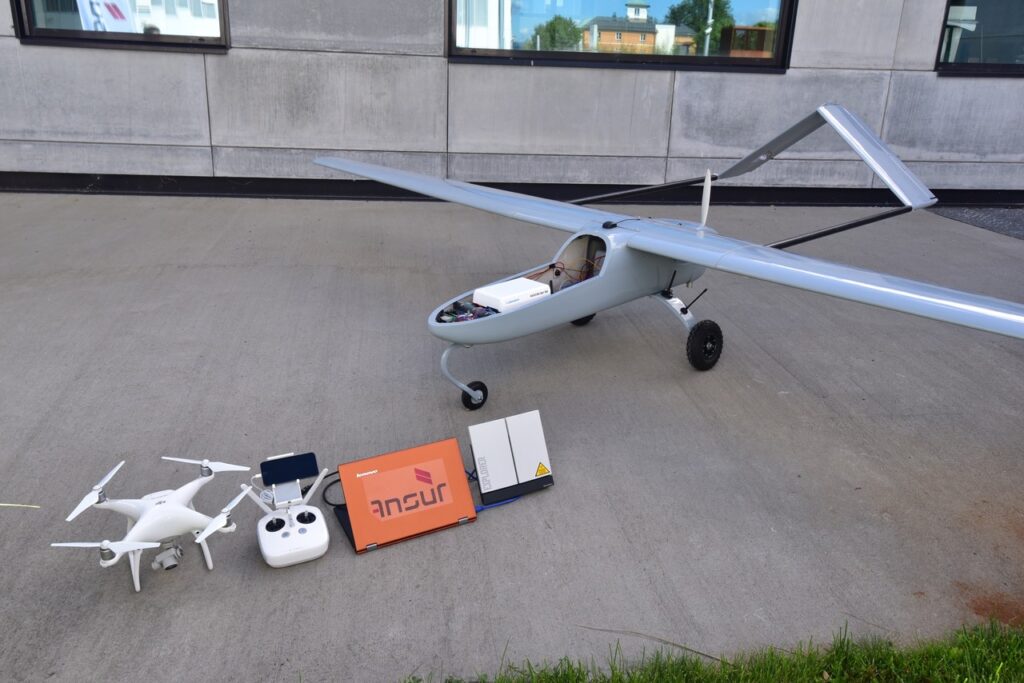
The ability to specifically target flights on field sites allows archaeologists to gain all the benefits of aerial imaging without the high costs of launching satellites or chartering planes . We also can fly multiple times, often on multiple days, meaning weather is much less of a concern. These detailed site maps can be used in combination with GIS and RS software (discussed later in this chapter) to create detailed maps, 3D models, and even reveal features otherwise hidden by vegetation . One example of this the Vanderbilt Initiative for Interdisciplinary Geospatial Research is using data gathered from various UAVs to create virtual reality models of Andean archaeological sites (Wolf, 2021). This project uses not only data collected by the researchers themselves, but also from an entire community of researchers via the Geospatial Platform for Andean Culture, History and Archaeology (Wernke & VanValkenburgh, 2023).
Radar uses radio waves to detect the size, position, and motion of objects by bouncing different wavelengths off anything within the detector’s range. You probably are already familiar with two of the most common uses of radar – speed detection and weather monitoring. Speed is measured by bouncing the radio waves off a moving object, with the doppler shift caused by the object giving a precise speed of the object relative to the observer. These are often used by traffic police worldwide to fine drivers for exceeding speed limits. We can also use the reflection of different wavelengths of radio to infer the size, location, and composition of clouds – hence the radar maps common on weather sites.
Cool stuff, but what does that have to do with archaeology? Well, beyond knowing if a site is accessible (due to rain or snow), radar can also be used to image what is underneath dirt or even solid rock. This is called ground penetrating radar, and has been used across the geosciences to image what is beneath the ground’s surface without having to dig. As we talk about in the Excavation chapter, archaeology is one of the only sciences that completely destroys our research sites. However, by using radar and remote sensing, we can save time and energy by knowing exactly where to dig and what we are likely to find (for a great example, see https://www.youtube.com/watch?v=hYyHIxPqfvo).
A related technology, sonar, can be used to accomplish something similar underwater. Sonar uses sound waves instead of radio waves, but the overall principles are the same. This can help archaeologists find the location of sunken ships, buildings, or other human-made objects from the comfort (and relative safety) of the surface. Many Remotely Operated Vehicles (ROVs) have been equipped with a combination of sonar and radar to more effectively map the ocean floor, leading to many major discoveries (see https://www.youtube.com/watch?v=8qCZ4CTs2pc and https://www.youtube.com/watch?v=BRlhRWShfJY).
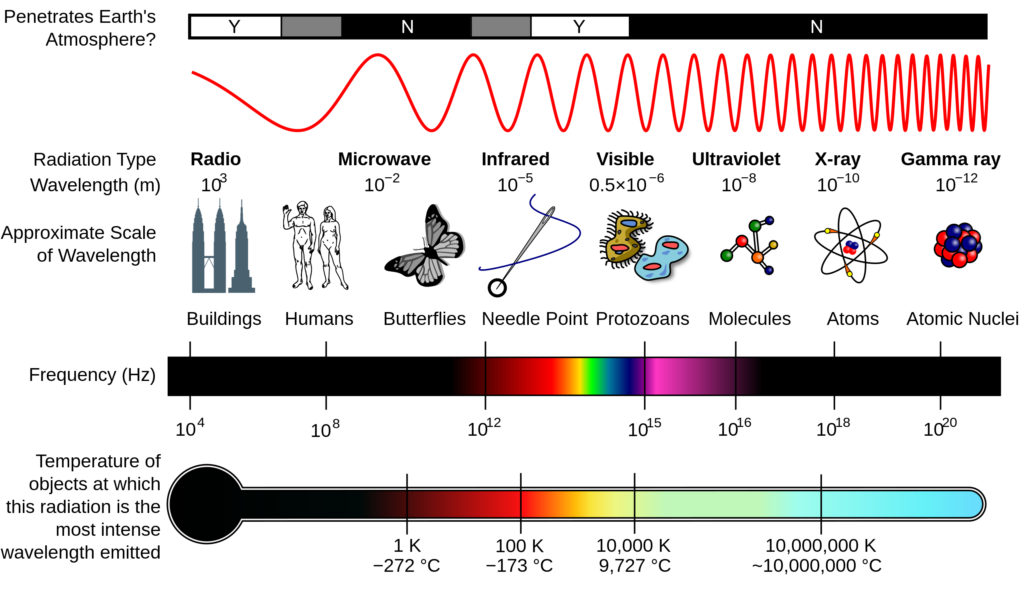
Back on dry land, another type of remote sensing uses light itself. LiDAR (light detection and ranging) works like ground penetrating radar and sonar. Light (typically a laser) is sent towards an object and reflected back to a sensor. Just like with sonar, the time between the laser pulse and reflected detection can be interpreted by a computer to determine the distance to the object. By combining many thousands of individual detections, a three-dimensional map of the environment can be created. The major benefits of LiDAR are increased speed and precision. Light has a much shorter wavelength than sound (sonar ~1.5 cm to ~ 1.5m; LiDAR ~900 nm to ~1050 nm; see Figure 7). LiDAR has been used extensively to make discoveries of sites in otherwise inaccessible places (see Wernke & VanValkenburgh, 2023).
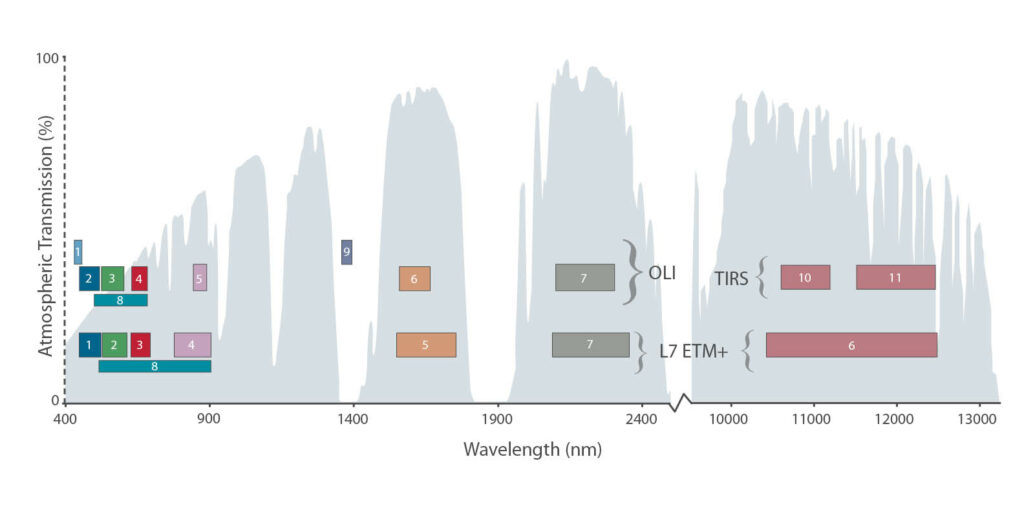
Archaeologists frequently use the same principles of remote sensing (RS) to detect different landscape features. One fortunate aspect of the involvement of NASA is that many space-based data sources are publicly available. The USGS has compiled much of this data on Earth Explorer (https://earthexplorer.usgs.gov/). For each pass of the satellite over an area, multiple images are taken at one time. However, if you were to download the files, you would find only black and white images. That’s because each image represents a single segment of the electromagnetic spectrum, called bands. These bands are specifically tailored to look only at one small frequency range, which is termed the reflectance for that wavelength. The reflectance each band refers to varies depending on the data source (see Figure 8). For example, Landsat 9 is the latest geospatial remote sensing satellite launched by NASA and has 11 bands, of which two focus on thermal imaging (NASA, n.d.).
As mentioned before, aircraft (planes, helicopters, or UAVs) can also be used to collect images. At the most basic level, these are typical color photographs just like the ones you might get from any digital camera. However, most aircraft intended to collect research-quality data will have sensors that are similar to the satellite sensors used for RS. The most common of these sensors include Red, Blue, and Green light (just like any digital camera) and NIR, or Near Infrared. GIS professionals (archaeologists, geographers, and other scientists) can use many different computer programs to combine the bands into color images, ranging from true-color to any combination of false-color images that help to highlight specific objects . It is difficult to make out what features might be important in the left side of Figure 9, but the differences between human development, vacant land, and bodies of water are immediately recognizable in the right side false-color image.
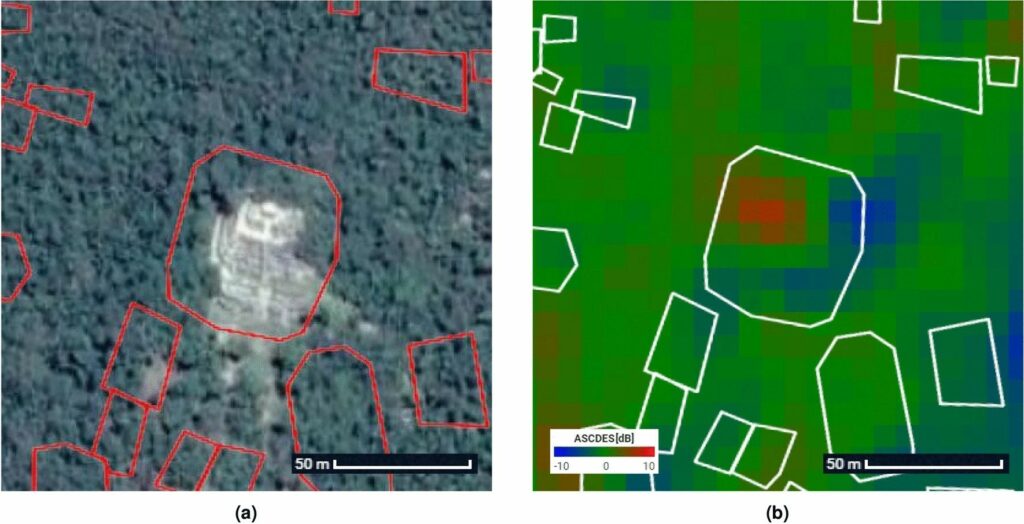
Together, these wavelengths are used to create the NDVI, or Normalized Difference Vegetation Index, which is used to measure plant health or the composition of the plant community in a native ecosystem. The NDVI can be visualized using false-color imagery, where each wavelength from Landsat (or any other camera sensitive to these wavelengths) is applied to one of the Red, Blue, and Green color bands (see Figure 9). These images have been used by archaeologists to uncover a variety of features, including ancient Mesoamerican cities currently covered by jungle (see Michenot et al., 2024).
While remote sensing can give great detail about a site quickly and (relatively) cheaply, there are times where being on-site is necessary. Since archaeology is one of the only sciences that destroys our study subjects, we prefer to leave materials in-place whenever possible. How can we get data without excavation (and thus, destruction)?
One nondestructive technique is to use Acoustic Reflectance . Sonar (mentioned earlier in this chapter) and echolocation both utilize sound to detect objects. Some bats, for example, send out very intense, high-frequency sound waves and listen for the reflection of those sound waves from different objects in the environment. Their brains then process that sound into a three-dimensional impression of the environment. The same idea is used with many autonomous devices, like self-navigating vacuum cleaners, to build a model of the environment and determine the best way to avoid obstacles. Archaeologists can use the same concept with artifacts within the ground, just sending the sound waves through the dirt rather than the air. Sensors (microphones) must be placed at regular intervals to gain a three dimensional view, based on how long the sound takes to reflect to each sensor. On the largest scales, this approach has been used in combination with seismometers (earthquake detectors) to create detailed maps of the deep interior of the Earth (see Kim et al., 2020).
Another non-invasive way to gather data is known as Electrical Resistivity Imaging (ERI). Contrary to what Pokémon taught us, all materials transmit electricity, just with differing amounts of resistance (measured in Ohms , Ω). Resistance can be thought of as how difficult it is for electricity to pass through the material, with lower resistance (> Ω) indicating easier passage of electricity and greater resistance (< Ω) indicating greater difficulty. This difficulty, in extreme situations, can result in heat (which is how induction light bulbs, electric stoves, and space heaters work). When applying ERI, just like with acoustic imaging, electrodes are placed in the ground at regular intervals. The closer the electrodes are to each other, the more detail can be seen, but the shallower and smaller the survey area is .
Magnetometry uses magnetic signals to perform a similar function. Magnetometers (the devices measure magnetic fields) can sense the fields generated by certain types of artifacts (such as iron nails or steel swords). Magnetic fields in a unit called Gauss (G), with more strongly magnetic objects creating a higher G field. When the objects’ fields interact with the magnetometers’ fields, a three-dimensional image can be generated. However, some objects are non-magnetic and thus can’t be detected as easily. For objects made of wood or non-magnetic materials, magnetometry can still give an indication of where artifacts may be located and thus help to guide the use of different imaging methods or excavations .
Archaeologists must prepare to study a site by carefully researching and predicting what materials may be found on a given excavation. If the site is covered by vegetation, ground-penetrating techniques like Acoustic Reflectance or ERI may be ineffective. Similarly, if the site is from a period where iron was not widely used, magnetometry will be ineffective.
Conclusion
Digitizing archaeological sites and data is becoming increasingly necessary for archaeologists. In the past, data may come from pedestrian surveys, shovel test pits, or full-sale excavations (see Excavation chapter), which simultaneously provide data but destroy the site we are studying. Modern techniques like remote sensing, acoustic reflectance, and magnetometry help archaeologists gather data and target excavations for specific purposes. UAVs help us further target remote sensing and LiDAR to build extremely detailed 3D models of sites prior and during excavation.
Once collected, data are then entered into digital format (most commonly .csv files) and analyzed using statistical programs. This helps archaeologists quantify sites and perform in-depth research within single sites and across multiple sites and geographic scales (from counties to continents). From there, data are put into a GIS program to create maps, identify features, and use advanced statistics to identify features that aren’t otherwise visible. These approaches are increasingly important in our digital world, as models are frequently made available to other researchers and to the general public – a vital component to both public outreach (see chapter) and to preserving cultural heritage for future generations (see heritage/descendant chapter).
References
Kosok, P. (1959). Astronomy, the Priesthood and the State New Aspects of ancient Nazca. Zeitschrift für Ethnologie, (H. 1), 5-18.
NASA. (n.d.). Landsat 9. LANDSAT 9. https://landsat.gsfc.nasa.gov/satellites/landsat-9/
Ruggles, C., & Saunders, N. J. (2012). Desert labyrinth: lines, landscape and meaning at Nazca, Peru. Antiquity, 86(334), 1126-1140.
U.S. Space Force. (2022, March 3). GPS accuracy. GPS.gov: GPS Accuracy. https://www.gps.gov/systems/gps/performance/accuracy/
USGS. (n.d.). USGS eros archive – products overview active. USGS EROS Archive – Products Overview | U.S. Geological Survey. https://www.usgs.gov/centers/eros/science/usgs-eros-archive-products-overview
Wernke, S. A., & VanValkenburgh, P. (n.d.). Geopacha. GeoPACHA. https://geopacha.org/
Wolf, A. (2021, November 12). NSF grants support Vanderbilt in high-tech archaeology information revolution. Vanderbilt University. https://news.vanderbilt.edu/2021/11/12/nsf-grants-support-vanderbilt-in-high-tech-archaeology-information-revolution/
